

PDF: 9795 KB - Bureau of Infrastructure, Transport and Regional ...
PDF: 9795 KB - Bureau of Infrastructure, Transport and Regional ...
PDF: 9795 KB - Bureau of Infrastructure, Transport and Regional ...

You also want an ePaper? Increase the reach of your titles
YUMPU automatically turns print PDFs into web optimized ePapers that Google loves.
BITRE | Working paper 73<br />
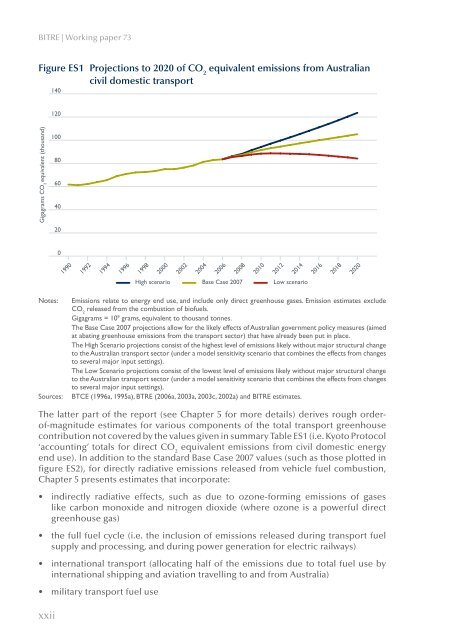
Figure ES1 Projections to 2020 <strong>of</strong> CO 2<br />
equivalent emissions from Australian<br />
civil domestic transport<br />
140<br />
120<br />
Gigagrams CO 2<br />
equivalent (thous<strong>and</strong>)<br />
100<br />
80<br />
60<br />
40<br />
20<br />
0<br />
1990<br />
1992<br />
1994<br />
1996<br />
1998<br />
2000<br />
2002<br />
2004<br />
2006<br />
2008<br />
2010<br />
2012<br />
2014<br />
2016<br />
2018<br />
2020<br />
High scenario Base Case 2007 Low scenario<br />
Notes:<br />
Sources:<br />
Emissions relate to energy end use, <strong>and</strong> include only direct greenhouse gases. Emission estimates exclude<br />
CO 2<br />
released from the combustion <strong>of</strong> bi<strong>of</strong>uels.<br />
Gigagrams = 10 9 grams, equivalent to thous<strong>and</strong> tonnes.<br />
The Base Case 2007 projections allow for the likely effects <strong>of</strong> Australian government policy measures (aimed<br />
at abating greenhouse emissions from the transport sector) that have already been put in place.<br />
The High Scenario projections consist <strong>of</strong> the highest level <strong>of</strong> emissions likely without major structural change<br />
to the Australian transport sector (under a model sensitivity scenario that combines the effects from changes<br />
to several major input settings).<br />
The Low Scenario projections consist <strong>of</strong> the lowest level <strong>of</strong> emissions likely without major structural change<br />
to the Australian transport sector (under a model sensitivity scenario that combines the effects from changes<br />
to several major input settings).<br />
BTCE (1996a, 1995a), BTRE (2006a, 2003a, 2003c, 2002a) <strong>and</strong> BITRE estimates.<br />
The latter part <strong>of</strong> the report (see Chapter 5 for more details) derives rough order<strong>of</strong>-magnitude<br />
estimates for various components <strong>of</strong> the total transport greenhouse<br />
contribution not covered by the values given in summary Table ES1 (i.e. Kyoto Protocol<br />
‘accounting’ totals for direct CO 2<br />
equivalent emissions from civil domestic energy<br />
end use). In addition to the st<strong>and</strong>ard Base Case 2007 values (such as those plotted in<br />
figure ES2), for directly radiative emissions released from vehicle fuel combustion,<br />
Chapter 5 presents estimates that incorporate:<br />
• indirectly radiative effects, such as due to ozone-forming emissions <strong>of</strong> gases<br />
like carbon monoxide <strong>and</strong> nitrogen dioxide (where ozone is a powerful direct<br />
greenhouse gas)<br />
• the full fuel cycle (i.e. the inclusion <strong>of</strong> emissions released during transport fuel<br />
supply <strong>and</strong> processing, <strong>and</strong> during power generation for electric railways)<br />
• international transport (allocating half <strong>of</strong> the emissions due to total fuel use by<br />
international shipping <strong>and</strong> aviation travelling to <strong>and</strong> from Australia)<br />
• military transport fuel use<br />
xxii


