

PDF: 9795 KB - Bureau of Infrastructure, Transport and Regional ...
PDF: 9795 KB - Bureau of Infrastructure, Transport and Regional ...
PDF: 9795 KB - Bureau of Infrastructure, Transport and Regional ...

Create successful ePaper yourself
Turn your PDF publications into a flip-book with our unique Google optimized e-Paper software.
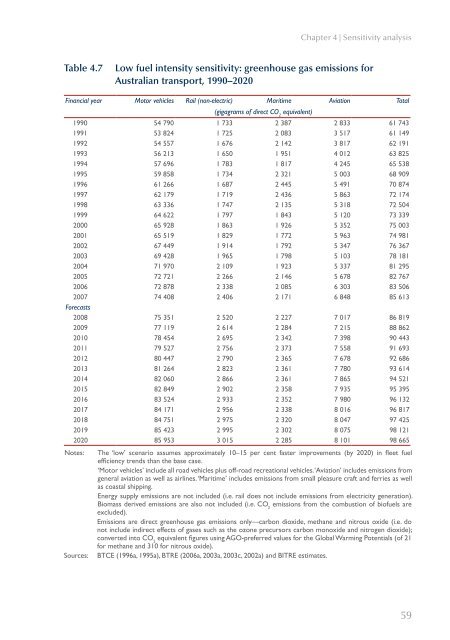
Chapter 4 | Sensitivity analysis<br />
Table 4.7<br />
Low fuel intensity sensitivity: greenhouse gas emissions for<br />
Australian transport, 1990–2020<br />
Financial year Motor vehicles Rail (non-electric) Maritime Aviation Total<br />
(gigagrams <strong>of</strong> direct CO 2<br />
equivalent)<br />
1990 54 790 1 733 2 387 2 833 61 743<br />
1991 53 824 1 725 2 083 3 517 61 149<br />
1992 54 557 1 676 2 142 3 817 62 191<br />
1993 56 213 1 650 1 951 4 012 63 825<br />
1994 57 696 1 783 1 817 4 245 65 538<br />
1995 59 858 1 734 2 321 5 003 68 909<br />
1996 61 266 1 687 2 445 5 491 70 874<br />
1997 62 179 1 719 2 436 5 863 72 174<br />
1998 63 336 1 747 2 135 5 318 72 504<br />
1999 64 622 1 797 1 843 5 120 73 339<br />
2000 65 928 1 863 1 926 5 352 75 003<br />
2001 65 519 1 829 1 772 5 963 74 981<br />
2002 67 449 1 914 1 792 5 347 76 367<br />
2003 69 428 1 965 1 798 5 103 78 181<br />
2004 71 970 2 109 1 923 5 337 81 295<br />
2005 72 721 2 266 2 146 5 678 82 767<br />
2006 72 878 2 338 2 085 6 303 83 506<br />
2007 74 408 2 406 2 171 6 848 85 613<br />
Forecasts<br />
2008 75 351 2 520 2 227 7 017 86 819<br />
2009 77 119 2 614 2 284 7 215 88 862<br />
2010 78 454 2 695 2 342 7 398 90 443<br />
2011 79 527 2 756 2 373 7 558 91 693<br />
2012 80 447 2 790 2 365 7 678 92 686<br />
2013 81 264 2 823 2 361 7 780 93 614<br />
2014 82 060 2 866 2 361 7 865 94 521<br />
2015 82 849 2 902 2 358 7 935 95 395<br />
2016 83 524 2 933 2 352 7 980 96 132<br />
2017 84 171 2 956 2 338 8 016 96 817<br />
2018 84 751 2 975 2 320 8 047 97 425<br />
2019 85 423 2 995 2 302 8 075 98 121<br />
2020 85 953 3 015 2 285 8 101 98 665<br />
Notes: The ‘low’ scenario assumes approximately 10–15 per cent faster improvements (by 2020) in fleet fuel<br />
efficiency trends than the base case.<br />
‘Motor vehicles’ include all road vehicles plus <strong>of</strong>f-road recreational vehicles. ‘Aviation’ includes emissions from<br />
general aviation as well as airlines. ‘Maritime’ includes emissions from small pleasure craft <strong>and</strong> ferries as well<br />
as coastal shipping.<br />
Energy supply emissions are not included (i.e. rail does not include emissions from electricity generation).<br />
Biomass derived emissions are also not included (i.e. CO 2<br />
emissions from the combustion <strong>of</strong> bi<strong>of</strong>uels are<br />
excluded).<br />
Emissions are direct greenhouse gas emissions only—carbon dioxide, methane <strong>and</strong> nitrous oxide (i.e. do<br />
not include indirect effects <strong>of</strong> gases such as the ozone precursors carbon monoxide <strong>and</strong> nitrogen dioxide);<br />
converted into CO 2<br />
equivalent figures using AGO-preferred values for the Global Warming Potentials (<strong>of</strong> 21<br />
for methane <strong>and</strong> 310 for nitrous oxide).<br />
Sources: BTCE (1996a, 1995a), BTRE (2006a, 2003a, 2003c, 2002a) <strong>and</strong> BITRE estimates.<br />
59


