

PDF: 9795 KB - Bureau of Infrastructure, Transport and Regional ...
PDF: 9795 KB - Bureau of Infrastructure, Transport and Regional ...
PDF: 9795 KB - Bureau of Infrastructure, Transport and Regional ...

You also want an ePaper? Increase the reach of your titles
YUMPU automatically turns print PDFs into web optimized ePapers that Google loves.
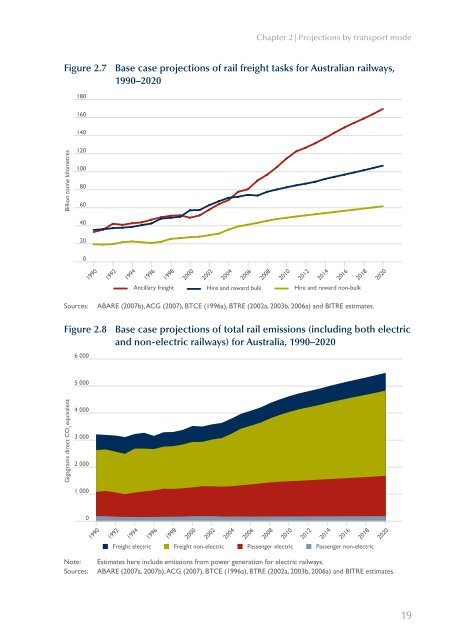
Chapter 2 | Projections by transport mode<br />
Figure 2.7 Base case projections <strong>of</strong> rail freight tasks for Australian railways,<br />
1990–2020<br />
180<br />
160<br />
140<br />
Billion tonne kilometres<br />
120<br />
100<br />
80<br />
60<br />
40<br />
20<br />
0<br />
1990<br />
1992<br />
1994<br />
1996<br />
1998<br />
2000<br />
2002<br />
2004<br />
2006<br />
2008<br />
2010<br />
2012<br />
2014<br />
2016<br />
2018<br />
2020<br />
Ancillary freight Hire <strong>and</strong> reward bulk Hire <strong>and</strong> reward non-bulk<br />
Sources:<br />
ABARE (2007b), ACG (2007), BTCE (1996a), BTRE (2002a, 2003b, 2006a) <strong>and</strong> BITRE estimates.<br />
Figure 2.8 Base case projections <strong>of</strong> total rail emissions (including both electric<br />
<strong>and</strong> non-electric railways) for Australia, 1990–2020<br />
6 000<br />
5 000<br />
Gigagrams direct CO 2<br />
equivalent<br />
4 000<br />
3 000<br />
2 000<br />
1 000<br />
0<br />
1990<br />
1992<br />
1994<br />
1996<br />
1998<br />
2000<br />
2002<br />
2004<br />
Freight electric Freight non-electric Passenger electric Passenger non-electric<br />
2006<br />
2008<br />
2010<br />
2012<br />
2014<br />
2016<br />
2018<br />
2020<br />
Note:<br />
Sources:<br />
Estimates here include emissions from power generation for electric railways.<br />
ABARE (2007a, 2007b), ACG (2007), BTCE (1996a), BTRE (2002a, 2003b, 2006a) <strong>and</strong> BITRE estimates.<br />
19


