Volume 1 - Executive Summary - Office of the Chief Financial Officer
Volume 1 - Executive Summary - Office of the Chief Financial Officer
Volume 1 - Executive Summary - Office of the Chief Financial Officer

Create successful ePaper yourself
Turn your PDF publications into a flip-book with our unique Google optimized e-Paper software.
Federal Grants Expenditures<br />
Unlike federal payments, which come directly from <strong>the</strong> U.S. Treasury as authorized by <strong>the</strong> annual Appropriations Act,<br />
federal grants are awarded by a federal agency.<br />
Table 5A-6 <strong>of</strong> <strong>the</strong> Appendix shows federal grant expenditures from FY 2008 through FY 2011 by agency. Overall,<br />
<strong>the</strong>ir annual growth rate was 13.2 percent. The Department <strong>of</strong> Health Care Finance received <strong>the</strong> majority <strong>of</strong> <strong>the</strong> funds,<br />
consisting primarily <strong>of</strong> funding for Medicaid.<br />
Expenditure Growth by Object Class, FY 2008 to FY 2011<br />
This section examines expenditures by object class --that is, by <strong>the</strong> type <strong>of</strong> services paid for, such as personal services,<br />
supplies, or fixed costs for rent or utilities – from FY 2008 through FY 2011. Since FY 2008, <strong>the</strong> average annual rate<br />
<strong>of</strong> growth for expenditures for nonpersonal services (NPS), such as rent and utilities, equipment, subsidies and transfers,<br />
and debt service, has fallen faster than personal services (PS), which include regular salaries and wages, overtime,<br />
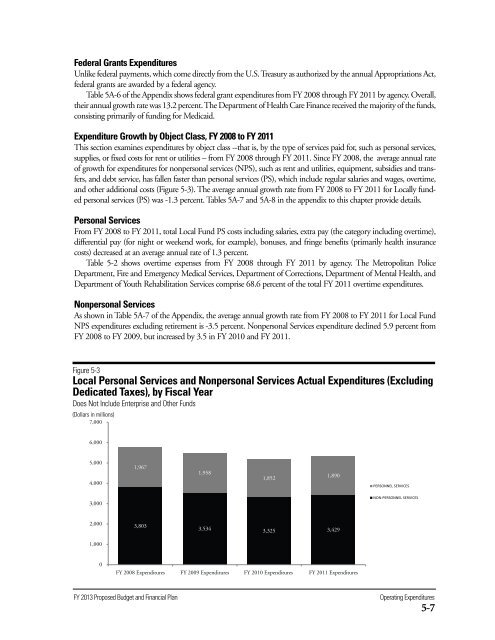
and o<strong>the</strong>r additional costs (Figure 5-3). The average annual growth rate from FY 2008 to FY 2011 for Locally funded<br />
personal services (PS) was -1.3 percent. Tables 5A-7 and 5A-8 in <strong>the</strong> appendix to this chapter provide details.<br />
Personal Services<br />
From FY 2008 to FY 2011, total Local Fund PS costs including salaries, extra pay (<strong>the</strong> category including overtime),<br />
differential pay (for night or weekend work, for example), bonuses, and fringe benefits (primarily health insurance<br />
costs) decreased at an average annual rate <strong>of</strong> 1.3 percent.<br />
Table 5-2 shows overtime expenses from FY 2008 through FY 2011 by agency. The Metropolitan Police<br />
Department, Fire and Emergency Medical Services, Department <strong>of</strong> Corrections, Department <strong>of</strong> Mental Health, and<br />
Department <strong>of</strong> Youth Rehabilitation Services comprise 68.6 percent <strong>of</strong> <strong>the</strong> total FY 2011 overtime expenditures.<br />
Nonpersonal Services<br />
As shown in Table 5A-7 <strong>of</strong> <strong>the</strong> Appendix, <strong>the</strong> average annual growth rate from FY 2008 to FY 2011 for Local Fund<br />
NPS expenditures excluding retirement is -3.5 percent. Nonpersonal Services expenditure declined 5.9 percent from<br />
FY 2008 to FY 2009, but increased by 3.5 in FY 2010 and FY 2011.<br />
Figure 5-3<br />
Local Personal Services and Nonpersonal Services Actual Expenditures (Excluding<br />
Dedicated Taxes), by Fiscal Year<br />
Does Not Include Enterprise and O<strong>the</strong>r Funds<br />
(Dollars in millions)<br />
7,000<br />
6,000<br />
5,000<br />
4,000<br />
1,967<br />
1,958<br />
1,852<br />
1,890<br />
3,000<br />
2,000<br />
3,803<br />
3,534 3,325 3,429<br />
1,000<br />
0<br />
FY 2008 Expenditures FY 2009 Expenditures FY 2010 Expenditures FY 2011 Expenditures<br />
FY 2013 Proposed Budget and <strong>Financial</strong> Plan<br />
Operating Expenditures<br />
5-7