Volume 1 - Executive Summary - Office of the Chief Financial Officer
Volume 1 - Executive Summary - Office of the Chief Financial Officer
Volume 1 - Executive Summary - Office of the Chief Financial Officer

Create successful ePaper yourself
Turn your PDF publications into a flip-book with our unique Google optimized e-Paper software.
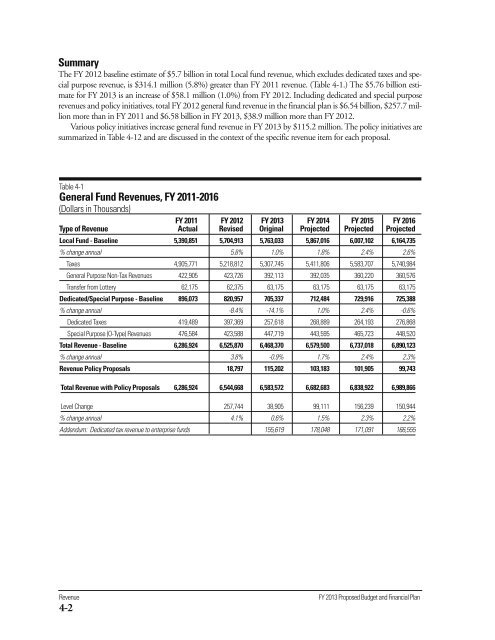
<strong>Summary</strong><br />
The FY 2012 baseline estimate <strong>of</strong> $5.7 billion in total Local fund revenue, which excludes dedicated taxes and special<br />
purpose revenue, is $314.1 million (5.8%) greater than FY 2011 revenue. (Table 4-1.) The $5.76 billion estimate<br />
for FY 2013 is an increase <strong>of</strong> $58.1 million (1.0%) from FY 2012. Including dedicated and special purpose<br />
revenues and policy initiatives, total FY 2012 general fund revenue in <strong>the</strong> financial plan is $6.54 billion, $257.7 million<br />
more than in FY 2011 and $6.58 billion in FY 2013, $38.9 million more than FY 2012.<br />
Various policy initiatives increase general fund revenue in FY 2013 by $115.2 million. The policy initiatives are<br />
summarized in Table 4-12 and are discussed in <strong>the</strong> context <strong>of</strong> <strong>the</strong> specific revenue item for each proposal.<br />
Table 4-1<br />
General Fund Revenues, FY 2011-2016<br />
(Dollars in Thousands)<br />
FY 2011 FY 2012 FY 2013 FY 2014 FY 2015 FY 2016<br />
Type <strong>of</strong> Revenue Actual Revised Original Projected Projected Projected<br />
Local Fund - Baseline 5,390,851 5,704,913 5,763,033 5,867,016 6,007,102 6,164,735<br />
% change annual 5.8% 1.0% 1.8% 2.4% 2.6%<br />
Taxes 4,905,771 5,218,812 5,307,745 5,411,806 5,583,707 5,740,984<br />
General Purpose Non-Tax Revenues 422,905 423,726 392,113 392,035 360,220 360,576<br />
Transfer from Lottery 62,175 62,375 63,175 63,175 63,175 63,175<br />
Dedicated/Special Purpose - Baseline 896,073 820,957 705,337 712,484 729,916 725,388<br />
% change annual -8.4% -14.1% 1.0% 2.4% -0.6%<br />
Dedicated Taxes 419,489 397,369 257,618 268,889 264,193 276,868<br />
Special Purpose (O-Type) Revenues 476,584 423,588 447,719 443,595 465,723 448,520<br />
Total Revenue - Baseline 6,286,924 6,525,870 6,468,370 6,579,500 6,737,018 6,890,123<br />
% change annual 3.8% -0.9% 1.7% 2.4% 2.3%<br />
Revenue Policy Proposals 18,797 115,202 103,183 101,905 99,743<br />
Total Revenue with Policy Proposals 6,286,924 6,544,668 6,583,572 6,682,683 6,838,922 6,989,866<br />
Level Change 257,744 38,905 99,111 156,239 150,944<br />
% change annual 4.1% 0.6% 1.5% 2.3% 2.2%<br />
Addendum: Dedicated tax revenue to enterprise funds 155,619 178,048 171,091 166,555<br />
Revenue<br />
4-2<br />
FY 2013 Proposed Budget and <strong>Financial</strong> Plan