Volume 1 - Executive Summary - Office of the Chief Financial Officer
Volume 1 - Executive Summary - Office of the Chief Financial Officer
Volume 1 - Executive Summary - Office of the Chief Financial Officer

You also want an ePaper? Increase the reach of your titles
YUMPU automatically turns print PDFs into web optimized ePapers that Google loves.
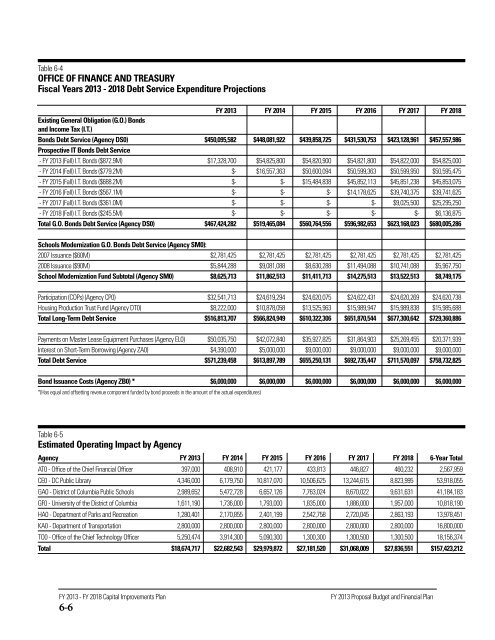
Table 6-4<br />
OFFICE OF FINANCE AND TREASURY<br />
Fiscal Years 2013 - 2018 Debt Service Expenditure Projections<br />
FY 2013 FY 2014 FY 2015 FY 2016 FY 2017 FY 2018<br />
Existing General Obligation (G.O.) Bonds<br />
and Income Tax (I.T.)<br />
Bonds Debt Service (Agency DS0) $450,095,582 $448,081,922 $439,858,725 $431,530,753 $423,128,961 $457,557,986<br />
Prospective IT Bonds Debt Service<br />
- FY 2013 (Fall) I.T. Bonds ($872.9M) $17,328,700 $54,825,800 $54,820,900 $54,821,800 $54,822,000 $54,825,000<br />
- FY 2014 (Fall) I.T. Bonds ($779.2M) $- $16,557,363 $50,600,094 $50,599,363 $50,599,950 $50,595,475<br />
- FY 2015 (Fall) I.T. Bonds ($688.2M) $- $- $15,484,838 $45,852,113 $45,851,238 $45,853,075<br />
- FY 2016 (Fall) I.T. Bonds ($567.1M) $- $- $- $14,178,625 $39,740,375 $39,741,625<br />
- FY 2017 (Fall) I.T. Bonds ($361.0M) $- $- $- $- $9,025,500 $25,295,250<br />
- FY 2018 (Fall) I.T. Bonds ($245.5M) $- $- $- $- $- $6,136,875<br />
Total G.O. Bonds Debt Service (Agency DS0) $467,424,282 $519,465,084 $560,764,556 $596,982,653 $623,168,023 $680,005,286<br />
Schools Modernization G.O. Bonds Debt Service (Agency SM0):<br />
2007 Issuance ($60M) $2,781,425 $2,781,425 $2,781,425 $2,781,425 $2,781,425 $2,781,425<br />
2008 Issuance ($90M) $5,844,288 $9,081,088 $8,630,288 $11,494,088 $10,741,088 $5,967,750<br />
School Modernization Fund Subtotal (Agency SM0) $8,625,713 $11,862,513 $11,411,713 $14,275,513 $13,522,513 $8,749,175<br />
Participation (COPs) (Agency CP0) $32,541,713 $24,619,294 $24,620,075 $24,622,431 $24,620,269 $24,620,738<br />
Housing Production Trust Fund (Agency DT0) $8,222,000 $10,878,058 $13,525,963 $15,989,947 $15,989,838 $15,985,688<br />
Total Long-Term Debt Service $516,813,707 $566,824,949 $610,322,306 $651,870,544 $677,300,642 $729,360,886<br />
Payments on Master Lease Equipment Purchases (Agency EL0) $50,035,750 $42,072,840 $35,927,825 $31,864,903 $25,269,455 $20,371,939<br />
Interest on Short-Term Borrowing (Agency ZA0) $4,390,000 $5,000,000 $9,000,000 $9,000,000 $9,000,000 $9,000,000<br />
Total Debt Service $571,239,458 $613,897,789 $655,250,131 $692,735,447 $711,570,097 $758,732,825<br />
Bond Issuance Costs (Agency ZB0) * $6,000,000 $6,000,000 $6,000,000 $6,000,000 $6,000,000 $6,000,000<br />
*(Has equal and <strong>of</strong>fsetting revenue component funded by bond proceeds in <strong>the</strong> amount <strong>of</strong> <strong>the</strong> actual expenditures)<br />
Table 6-5<br />
Estimated Operating Impact by Agency<br />
Agency FY 2013 FY 2014 FY 2015 FY 2016 FY 2017 FY 2018 6-Year Total<br />
AT0 - <strong>Office</strong> <strong>of</strong> <strong>the</strong> <strong>Chief</strong> <strong>Financial</strong> <strong>Office</strong>r 397,000 408,910 421,177 433,813 446,827 460,232 2,567,959<br />
CE0 - DC Public Library 4,346,000 6,179,750 10,817,070 10,506,625 13,244,615 8,823,995 53,918,055<br />
GA0 - District <strong>of</strong> Columbia Public Schools 2,989,652 5,472,728 6,657,126 7,763,024 8,670,022 9,631,631 41,184,183<br />
GF0 - University <strong>of</strong> <strong>the</strong> District <strong>of</strong> Columbia 1,611,190 1,736,000 1,793,000 1,835,000 1,886,000 1,957,000 10,818,190<br />
HA0 - Department <strong>of</strong> Parks and Recreation 1,280,401 2,170,855 2,401,199 2,542,758 2,720,045 2,863,193 13,978,451<br />
KA0 - Department <strong>of</strong> Transportation 2,800,000 2,800,000 2,800,000 2,800,000 2,800,000 2,800,000 16,800,000<br />
TO0 - <strong>Office</strong> <strong>of</strong> <strong>the</strong> <strong>Chief</strong> Technology <strong>Office</strong>r 5,250,474 3,914,300 5,090,300 1,300,300 1,300,500 1,300,500 18,156,374<br />
Total $18,674,717 $22,682,543 $29,979,872 $27,181,520 $31,068,009 $27,836,551 $157,423,212<br />
FY 2013 - FY 2018 Capital Improvements Plan<br />
6-6<br />
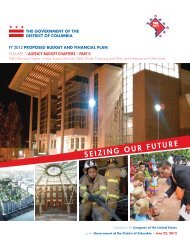
FY 2013 Proposal Budget and <strong>Financial</strong> Plan