Volume 1 - Executive Summary - Office of the Chief Financial Officer
Volume 1 - Executive Summary - Office of the Chief Financial Officer
Volume 1 - Executive Summary - Office of the Chief Financial Officer

You also want an ePaper? Increase the reach of your titles
YUMPU automatically turns print PDFs into web optimized ePapers that Google loves.
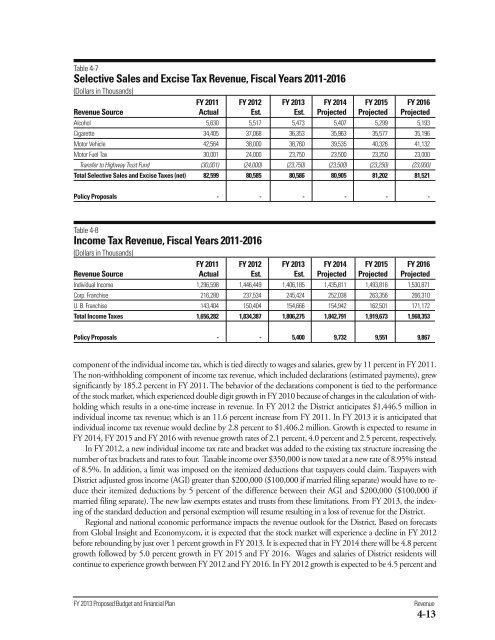
Table 4-7<br />
Selective Sales and Excise Tax Revenue, Fiscal Years 2011-2016<br />
(Dollars in Thousands)<br />
FY 2011 FY 2012 FY 2013 FY 2014 FY 2015 FY 2016<br />
Revenue Source Actual Est. Est. Projected Projected Projected<br />
Alcohol 5,630 5,517 5,473 5,407 5,299 5,193<br />
Cigarette 34,405 37,068 36,353 35,963 35,577 35,196<br />
Motor Vehicle 42,564 38,000 38,760 39,535 40,326 41,132<br />
Motor Fuel Tax 30,001 24,000 23,750 23,500 23,250 23,000<br />
Transfer to Highway Trust Fund (30,001) (24,000) (23,750) (23,500) (23,250) (23,000)<br />
Total Selective Sales and Excise Taxes (net) 82,599 80,585 80,586 80,905 81,202 81,521<br />
Policy Proposals - - - - - -<br />
Table 4-8<br />
Income Tax Revenue, Fiscal Years 2011-2016<br />
(Dollars in Thousands)<br />
FY 2011 FY 2012 FY 2013 FY 2014 FY 2015 FY 2016<br />
Revenue Source Actual Est. Est. Projected Projected Projected<br />
Individual Income 1,296,598 1,446,449 1,406,185 1,435,811 1,493,816 1,530,871<br />
Corp. Franchise 216,280 237,534 245,424 252,038 263,356 266,310<br />
U. B. Franchise 143,404 150,404 154,666 154,942 162,501 171,172<br />
Total Income Taxes 1,656,282 1,834,387 1,806,275 1,842,791 1,919,673 1,968,353<br />
Policy Proposals - - 5,400 9,732 9,551 9,867<br />
component <strong>of</strong> <strong>the</strong> individual income tax, which is tied directly to wages and salaries, grew by 11 percent in FY 2011.<br />
The non-withholding component <strong>of</strong> income tax revenue, which included declarations (estimated payments), grew<br />
significantly by 185.2 percent in FY 2011. The behavior <strong>of</strong> <strong>the</strong> declarations component is tied to <strong>the</strong> performance<br />
<strong>of</strong> <strong>the</strong> stock market, which experienced double digit growth in FY 2010 because <strong>of</strong> changes in <strong>the</strong> calculation <strong>of</strong> withholding<br />
which results in a one-time increase in revenue. In FY 2012 <strong>the</strong> District anticipates $1,446.5 million in<br />
individual income tax revenue; which is an 11.6 percent increase from FY 2011. In FY 2013 it is anticipated that<br />
individual income tax revenue would decline by 2.8 percent to $1,406.2 million. Growth is expected to resume in<br />
FY 2014, FY 2015 and FY 2016 with revenue growth rates <strong>of</strong> 2.1 percent, 4.0 percent and 2.5 percent, respectively.<br />
In FY 2012, a new individual income tax rate and bracket was added to <strong>the</strong> existing tax structure increasing <strong>the</strong><br />
number <strong>of</strong> tax brackets and rates to four. Taxable income over $350,000 is now taxed at a new rate <strong>of</strong> 8.95% instead<br />
<strong>of</strong> 8.5%. In addition, a limit was imposed on <strong>the</strong> itemized deductions that taxpayers could claim. Taxpayers with<br />
District adjusted gross income (AGI) greater than $200,000 ($100,000 if married filing separate) would have to reduce<br />
<strong>the</strong>ir itemized deductions by 5 percent <strong>of</strong> <strong>the</strong> difference between <strong>the</strong>ir AGI and $200,000 ($100,000 if<br />
married filing separate). The new law exempts estates and trusts from <strong>the</strong>se limitations. From FY 2013, <strong>the</strong> indexing<br />
<strong>of</strong> <strong>the</strong> standard deduction and personal exemption will resume resulting in a loss <strong>of</strong> revenue for <strong>the</strong> District.<br />
Regional and national economic performance impacts <strong>the</strong> revenue outlook for <strong>the</strong> District. Based on forecasts<br />
from Global Insight and Economy.com, it is expected that <strong>the</strong> stock market will experience a decline in FY 2012<br />
before rebounding by just over 1 percent growth in FY 2013. It is expected that in FY 2014 <strong>the</strong>re will be 4.8 percent<br />
growth followed by 5.0 percent growth in FY 2015 and FY 2016. Wages and salaries <strong>of</strong> District residents will<br />
continue to experience growth between FY 2012 and FY 2016. In FY 2012 growth is expected to be 4.5 percent and<br />
FY 2013 Proposed Budget and <strong>Financial</strong> Plan<br />
Revenue<br />
4-13