Volume 1 - Executive Summary - Office of the Chief Financial Officer
Volume 1 - Executive Summary - Office of the Chief Financial Officer
Volume 1 - Executive Summary - Office of the Chief Financial Officer

You also want an ePaper? Increase the reach of your titles
YUMPU automatically turns print PDFs into web optimized ePapers that Google loves.
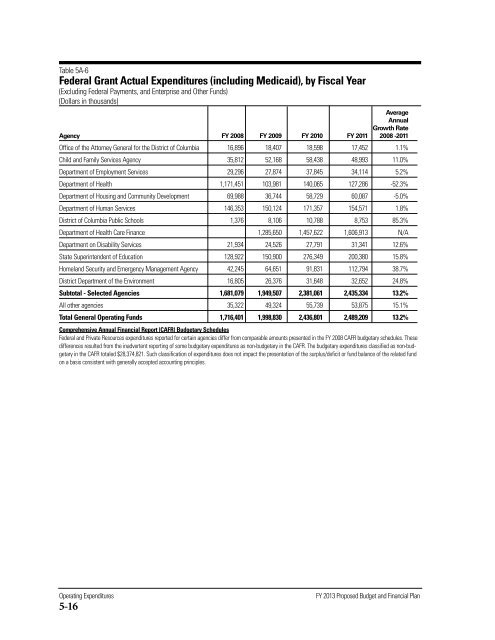
Table 5A-6<br />
Federal Grant Actual Expenditures (including Medicaid), by Fiscal Year<br />
(Excluding Federal Payments, and Enterprise and O<strong>the</strong>r Funds)<br />
(Dollars in thousands)<br />
Average<br />
Annual<br />
Growth Rate<br />
Agency FY 2008 FY 2009 FY 2010 FY 2011 2008 -2011<br />
<strong>Office</strong> <strong>of</strong> <strong>the</strong> Attorney General for <strong>the</strong> District <strong>of</strong> Columbia 16,896 18,407 18,598 17,452 1.1%<br />
Child and Family Services Agency 35,812 52,168 58,438 48,993 11.0%<br />
Department <strong>of</strong> Employment Services 29,296 27,874 37,845 34,114 5.2%<br />
Department <strong>of</strong> Health 1,171,451 103,981 140,065 127,286 -52.3%<br />
Department <strong>of</strong> Housing and Community Development 69,988 36,744 58,729 60,087 -5.0%<br />
Department <strong>of</strong> Human Services 146,353 150,124 171,357 154,571 1.8%<br />
District <strong>of</strong> Columbia Public Schools 1,376 8,106 10,788 8,753 85.3%<br />
Department <strong>of</strong> Health Care Finance 1,285,650 1,457,622 1,606,913 N/A<br />
Department on Disability Services 21,934 24,526 27,791 31,341 12.6%<br />
State Superintendent <strong>of</strong> Education 128,922 150,900 276,349 200,380 15.8%<br />
Homeland Security and Emergency Management Agency 42,245 64,651 91,831 112,794 38.7%<br />
District Department <strong>of</strong> <strong>the</strong> Environment 16,805 26,376 31,648 32,652 24.8%<br />
Subtotal - Selected Agencies 1,681,079 1,949,507 2,381,061 2,435,334 13.2%<br />
All o<strong>the</strong>r agencies 35,322 49,324 55,739 53,875 15.1%<br />
Total General Operating Funds 1,716,401 1,998,830 2,436,801 2,489,209 13.2%<br />
Comprehensive Annual <strong>Financial</strong> Report (CAFR) Budgetary Schedules<br />
Federal and Private Resources expenditures reported for certain agencies differ from comparable amounts presented in <strong>the</strong> FY 2008 CAFR budgetary schedules. These<br />
differences resulted from <strong>the</strong> inadvertent reporting <strong>of</strong> some budgetary expenditures as non-budgetary in <strong>the</strong> CAFR. The budgetary expenditures classified as non-budgetary<br />
in <strong>the</strong> CAFR totaled $28,374,821. Such classification <strong>of</strong> expenditures does not impact <strong>the</strong> presentation <strong>of</strong> <strong>the</strong> surplus/deficit or fund balance <strong>of</strong> <strong>the</strong> related fund<br />
on a basis consistent with generally accepted accounting principles.<br />
Operating Expenditures<br />
5-16<br />
FY 2013 Proposed Budget and <strong>Financial</strong> Plan