

Garnaut Fitzgerald Review of Commonwealth-State Funding
Garnaut Fitzgerald Review of Commonwealth-State Funding
Garnaut Fitzgerald Review of Commonwealth-State Funding

Create successful ePaper yourself
Turn your PDF publications into a flip-book with our unique Google optimized e-Paper software.
CHAPTER 8: Federal Policy Effects<br />
on Interstate Distribution <strong>of</strong> Incomes and Economic Activity<br />
8.2 <strong>Commonwealth</strong> income transfers<br />
and production effects<br />
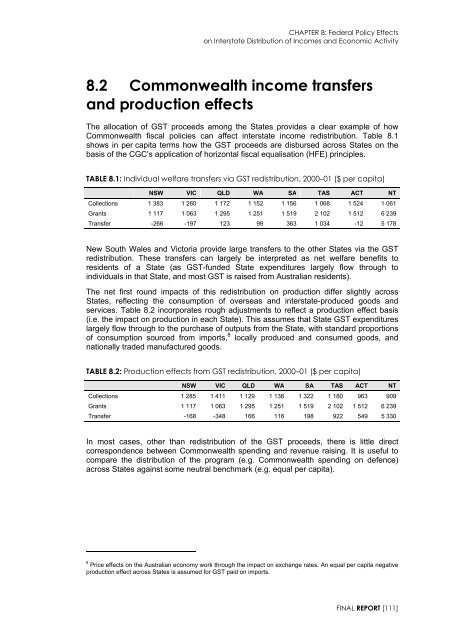
The allocation <strong>of</strong> GST proceeds among the <strong>State</strong>s provides a clear example <strong>of</strong> how<br />
<strong>Commonwealth</strong> fiscal policies can affect interstate income redistribution. Table 8.1<br />
shows in per capita terms how the GST proceeds are disbursed across <strong>State</strong>s on the<br />
basis <strong>of</strong> the CGC’s application <strong>of</strong> horizontal fiscal equalisation (HFE) principles.<br />
TABLE 8.1: Individual welfare transfers via GST redistribution, 2000–01 ($ per capita)<br />
NSW VIC QLD WA SA TAS ACT NT<br />
Collections 1 383 1 260 1 172 1 152 1 156 1 068 1 524 1 061<br />
Grants 1 117 1 063 1 295 1 251 1 519 2 102 1 512 6 239<br />
Transfer -266 -197 123 99 363 1 034 -12 5 178<br />
New South Wales and Victoria provide large transfers to the other <strong>State</strong>s via the GST<br />
redistribution. These transfers can largely be interpreted as net welfare benefits to<br />
residents <strong>of</strong> a <strong>State</strong> (as GST-funded <strong>State</strong> expenditures largely flow through to<br />
individuals in that <strong>State</strong>, and most GST is raised from Australian residents).<br />
The net first round impacts <strong>of</strong> this redistribution on production differ slightly across<br />
<strong>State</strong>s, reflecting the consumption <strong>of</strong> overseas and interstate-produced goods and<br />
services. Table 8.2 incorporates rough adjustments to reflect a production effect basis<br />
(i.e. the impact on production in each <strong>State</strong>). This assumes that <strong>State</strong> GST expenditures<br />
largely flow through to the purchase <strong>of</strong> outputs from the <strong>State</strong>, with standard proportions<br />
<strong>of</strong> consumption sourced from imports, 8 locally produced and consumed goods, and<br />
nationally traded manufactured goods.<br />
TABLE 8.2: Production effects from GST redistribution, 2000–01 ($ per capita)<br />
NSW VIC QLD WA SA TAS ACT NT<br />
Collections 1 285 1 411 1 129 1 136 1 322 1 180 963 909<br />
Grants 1 117 1 063 1 295 1 251 1 519 2 102 1 512 6 239<br />
Transfer -168 -348 166 116 198 922 549 5 330<br />
In most cases, other than redistribution <strong>of</strong> the GST proceeds, there is little direct<br />
correspondence between <strong>Commonwealth</strong> spending and revenue raising. It is useful to<br />
compare the distribution <strong>of</strong> the program (e.g. <strong>Commonwealth</strong> spending on defence)<br />
across <strong>State</strong>s against some neutral benchmark (e.g. equal per capita).<br />
8<br />
Price effects on the Australian economy work through the impact on exchange rates. An equal per capita negative<br />
production effect across <strong>State</strong>s is assumed for GST paid on imports.<br />
FINAL REPORT [111]


