

Garnaut Fitzgerald Review of Commonwealth-State Funding
Garnaut Fitzgerald Review of Commonwealth-State Funding
Garnaut Fitzgerald Review of Commonwealth-State Funding

You also want an ePaper? Increase the reach of your titles
YUMPU automatically turns print PDFs into web optimized ePapers that Google loves.
CHAPTER 11: Simplicity, Transparency and Accountability –<br />
Anomalies and Unintended Consequences<br />
Inadequate recognition <strong>of</strong> the costs <strong>of</strong> social and physical infrastructure in large cities by<br />
the CGC has affected <strong>State</strong> Government capacity to maintain the quality <strong>of</strong> urban<br />
services. In Sydney at least, this seems to have some causal relationship to resistance<br />
to high levels <strong>of</strong> international migration, which, if it were to the influential in<br />
<strong>Commonwealth</strong> immigration policy, would be seriously damaging to development,<br />
nationally and in all <strong>State</strong>s.<br />
Law and order<br />
International studies have demonstrated the positive correlation between crime rates<br />
and town size (International Crime Victims Survey Working Group 2000). The CGC’s<br />
current assessments <strong>of</strong> <strong>State</strong> spending on law and order do not properly reflect this<br />
influence. A small allowance is made for extra demands on police, but none for extra<br />
demands on courts and the prison system.<br />
Equal treatment <strong>of</strong> Indigenous Australians<br />
The CGC assumes that Indigenous people, identified in the five-yearly census, are<br />
comparable in terms <strong>of</strong> their needs for <strong>State</strong> services if they are comparable in terms <strong>of</strong><br />
characteristics such as age, location, income and English fluency. This approach is<br />
questionable.<br />
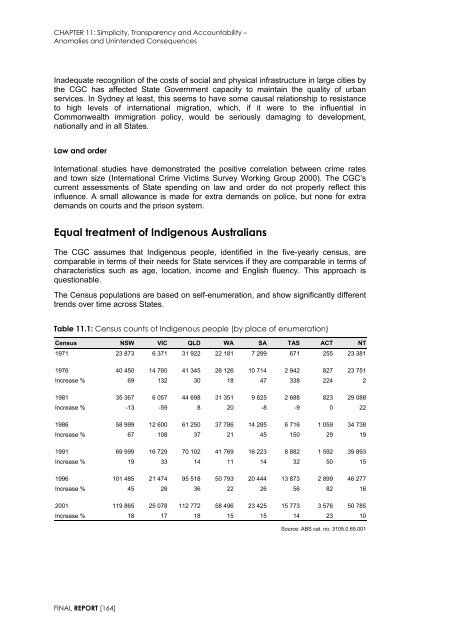
The Census populations are based on self-enumeration, and show significantly different<br />
trends over time across <strong>State</strong>s.<br />
Table 11.1: Census counts <strong>of</strong> Indigenous people (by place <strong>of</strong> enumeration)<br />
Census NSW VIC QLD WA SA TAS ACT NT<br />
1971 23 873 6 371 31 922 22 181 7 299 671 255 23 381<br />
1976 40 450 14 760 41 345 26 126 10 714 2 942 827 23 751<br />
Increase % 69 132 30 18 47 338 224 2<br />
1981 35 367 6 057 44 698 31 351 9 825 2 688 823 29 088<br />
Increase % -13 -59 8 20 -8 -9 0 22<br />
1986 58 999 12 600 61 250 37 786 14 285 6 716 1 059 34 738<br />
Increase % 67 108 37 21 45 150 29 19<br />
1991 69 999 16 729 70 102 41 769 16 223 8 882 1 592 39 893<br />
Increase % 19 33 14 11 14 32 50 15<br />
1996 101 485 21 474 95 518 50 793 20 444 13 873 2 899 46 277<br />
Increase % 45 28 36 22 26 56 82 16<br />
2001 119 865 25 078 112 772 58 496 23 425 15 773 3 576 50 785<br />
Increase % 18 17 18 15 15 14 23 10<br />
Source: ABS cat. no. 3105.0.65.001<br />
FINAL REPORT [164]


