

Garnaut Fitzgerald Review of Commonwealth-State Funding
Garnaut Fitzgerald Review of Commonwealth-State Funding
Garnaut Fitzgerald Review of Commonwealth-State Funding

Create successful ePaper yourself
Turn your PDF publications into a flip-book with our unique Google optimized e-Paper software.
CHAPTER 13: <strong>Commonwealth</strong>–<strong>State</strong> Financial Relations<br />
for the 21 st Century<br />
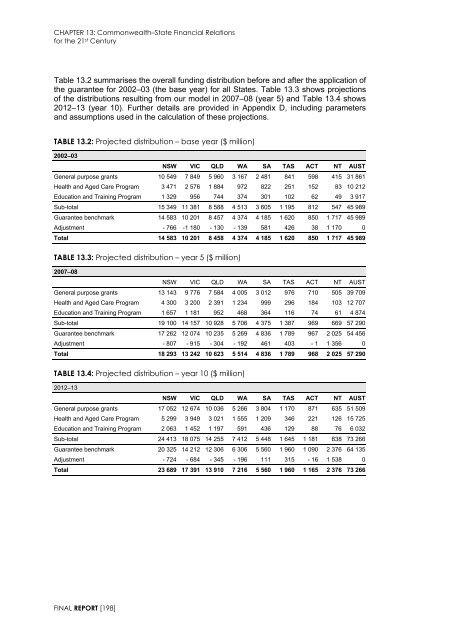
Table 13.2 summarises the overall funding distribution before and after the application <strong>of</strong><br />
the guarantee for 2002–03 (the base year) for all <strong>State</strong>s. Table 13.3 shows projections<br />
<strong>of</strong> the distributions resulting from our model in 2007–08 (year 5) and Table 13.4 shows<br />
2012–13 (year 10). Further details are provided in Appendix D, including parameters<br />
and assumptions used in the calculation <strong>of</strong> these projections.<br />
TABLE 13.2: Projected distribution – base year ($ million)<br />
2002–03<br />
NSW VIC QLD WA SA TAS ACT NT AUST<br />
General purpose grants 10 549 7 849 5 960 3 167 2 481 841 598 415 31 861<br />
Health and Aged Care Program 3 471 2 576 1 884 972 822 251 152 83 10 212<br />
Education and Training Program 1 329 956 744 374 301 102 62 49 3 917<br />
Sub-total 15 349 11 381 8 588 4 513 3 605 1 195 812 547 45 989<br />
Guarantee benchmark 14 583 10 201 8 457 4 374 4 185 1 620 850 1 717 45 989<br />
Adjustment - 766 -1 180 - 130 - 139 581 426 38 1 170 0<br />
Total 14 583 10 201 8 458 4 374 4 185 1 620 850 1 717 45 989<br />
TABLE 13.3: Projected distribution – year 5 ($ million)<br />
2007–08<br />
NSW VIC QLD WA SA TAS ACT NT AUST<br />
General purpose grants 13 143 9 776 7 584 4 005 3 012 976 710 505 39 709<br />
Health and Aged Care Program 4 300 3 200 2 391 1 234 999 296 184 103 12 707<br />
Education and Training Program 1 657 1 181 952 468 364 116 74 61 4 874<br />
Sub-total 19 100 14 157 10 928 5 706 4 375 1 387 969 669 57 290<br />
Guarantee benchmark 17 262 12 074 10 235 5 269 4 836 1 789 967 2 025 54 456<br />
Adjustment - 807 - 915 - 304 - 192 461 403 - 1 1 356 0<br />
Total 18 293 13 242 10 623 5 514 4 836 1 789 968 2 025 57 290<br />
TABLE 13.4: Projected distribution – year 10 ($ million)<br />
2012–13<br />
NSW VIC QLD WA SA TAS ACT NT AUST<br />
General purpose grants 17 052 12 674 10 036 5 266 3 804 1 170 871 635 51 509<br />
Health and Aged Care Program 5 299 3 949 3 021 1 555 1 209 346 221 126 15 725<br />
Education and Training Program 2 063 1 452 1 197 591 436 129 88 76 6 032<br />
Sub-total 24 413 18 075 14 255 7 412 5 448 1 645 1 181 838 73 266<br />
Guarantee benchmark 20 325 14 212 12 306 6 306 5 560 1 960 1 090 2 376 64 135<br />
Adjustment - 724 - 684 - 345 - 196 111 315 - 16 1 538 0<br />
Total 23 689 17 391 13 910 7 216 5 560 1 960 1 165 2 376 73 266<br />
FINAL REPORT [198]


