

Garnaut Fitzgerald Review of Commonwealth-State Funding
Garnaut Fitzgerald Review of Commonwealth-State Funding
Garnaut Fitzgerald Review of Commonwealth-State Funding

You also want an ePaper? Increase the reach of your titles
YUMPU automatically turns print PDFs into web optimized ePapers that Google loves.
CHAPTER 8: Federal Policy Effects<br />
on Interstate Distribution <strong>of</strong> Incomes and Economic Activity<br />
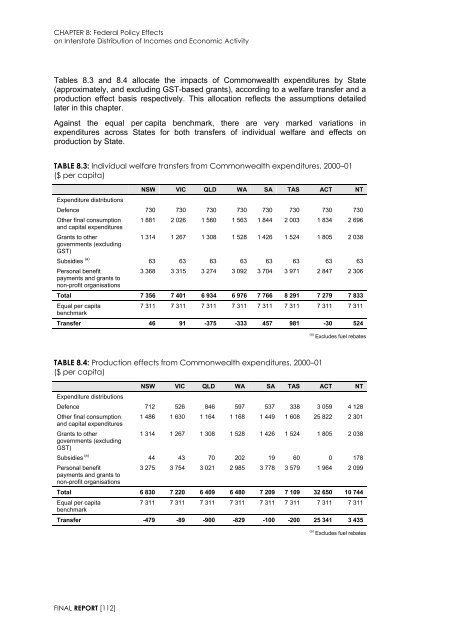
Tables 8.3 and 8.4 allocate the impacts <strong>of</strong> <strong>Commonwealth</strong> expenditures by <strong>State</strong><br />
(approximately, and excluding GST-based grants), according to a welfare transfer and a<br />
production effect basis respectively. This allocation reflects the assumptions detailed<br />
later in this chapter.<br />
Against the equal per capita benchmark, there are very marked variations in<br />
expenditures across <strong>State</strong>s for both transfers <strong>of</strong> individual welfare and effects on<br />
production by <strong>State</strong>.<br />
TABLE 8.3: Individual welfare transfers from <strong>Commonwealth</strong> expenditures, 2000–01<br />
($ per capita)<br />
NSW VIC QLD WA SA TAS ACT NT<br />
Expenditure distributions<br />
Defence 730 730 730 730 730 730 730 730<br />
Other final consumption 1 881 2 026 1 560 1 563 1 844 2 003 1 834 2 696<br />
and capital expenditures<br />
Grants to other<br />
governments (excluding<br />
GST)<br />
1 314 1 267 1 308 1 528 1 426 1 524 1 805 2 038<br />
Subsidies (a) 63 63 63 63 63 63 63 63<br />
Personal benefit<br />
payments and grants to<br />
non-pr<strong>of</strong>it organisations<br />
3 368 3 315 3 274 3 092 3 704 3 971 2 847 2 306<br />
Total 7 356 7 401 6 934 6 976 7 766 8 291 7 279 7 833<br />
Equal per capita<br />
benchmark<br />
7 311 7 311 7 311 7 311 7 311 7 311 7 311 7 311<br />
Transfer 46 91 -375 -333 457 981 -30 524<br />
(a) Excludes fuel rebates<br />
TABLE 8.4: Production effects from <strong>Commonwealth</strong> expenditures, 2000–01<br />
($ per capita)<br />
NSW VIC QLD WA SA TAS ACT NT<br />
Expenditure distributions<br />
Defence 712 526 846 597 537 338 3 059 4 128<br />
Other final consumption 1 486 1 630 1 164 1 168 1 449 1 608 25 822 2 301<br />
and capital expenditures<br />
Grants to other<br />
governments (excluding<br />
GST)<br />
1 314 1 267 1 308 1 528 1 426 1 524 1 805 2 038<br />
Subsidies (a) 44 43 70 202 19 60 0 178<br />
Personal benefit<br />
payments and grants to<br />
non-pr<strong>of</strong>it organisations<br />
3 275 3 754 3 021 2 985 3 778 3 579 1 964 2 099<br />
Total 6 830 7 220 6 409 6 480 7 209 7 109 32 650 10 744<br />
Equal per capita<br />
benchmark<br />
7 311 7 311 7 311 7 311 7 311 7 311 7 311 7 311<br />
Transfer -479 -89 -900 -829 -100 -200 25 341 3 435<br />
(a) Excludes fuel rebates<br />
FINAL REPORT [112]


