

Garnaut Fitzgerald Review of Commonwealth-State Funding
Garnaut Fitzgerald Review of Commonwealth-State Funding
Garnaut Fitzgerald Review of Commonwealth-State Funding

You also want an ePaper? Increase the reach of your titles
YUMPU automatically turns print PDFs into web optimized ePapers that Google loves.
CHAPTER 8: Federal Policy Effects<br />
on Interstate Distribution <strong>of</strong> Incomes and Economic Activity<br />
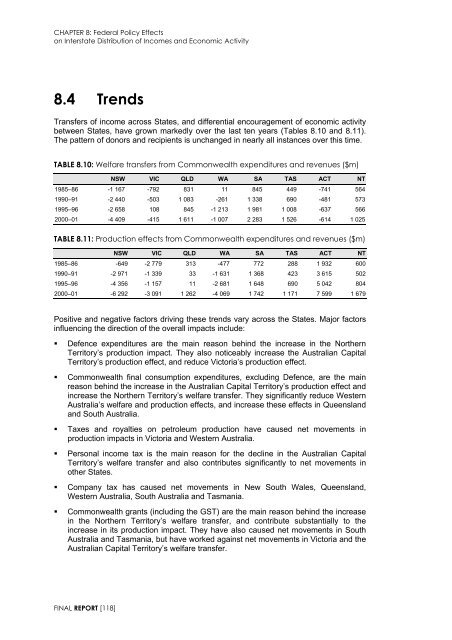
8.4 Trends<br />
Transfers <strong>of</strong> income across <strong>State</strong>s, and differential encouragement <strong>of</strong> economic activity<br />
between <strong>State</strong>s, have grown markedly over the last ten years (Tables 8.10 and 8.11).<br />
The pattern <strong>of</strong> donors and recipients is unchanged in nearly all instances over this time.<br />
TABLE 8.10: Welfare transfers from <strong>Commonwealth</strong> expenditures and revenues ($m)<br />
NSW VIC QLD WA SA TAS ACT NT<br />
1985–86 -1 167 -792 831 11 845 449 -741 564<br />
1990–91 -2 440 -503 1 083 -261 1 338 690 -481 573<br />
1995–96 -2 658 108 845 -1 213 1 981 1 008 -637 566<br />
2000–01 -4 409 -415 1 611 -1 007 2 283 1 526 -614 1 025<br />
TABLE 8.11: Production effects from <strong>Commonwealth</strong> expenditures and revenues ($m)<br />
NSW VIC QLD WA SA TAS ACT NT<br />
1985–86 -649 -2 779 313 -477 772 288 1 932 600<br />
1990–91 -2 971 -1 339 33 -1 631 1 368 423 3 615 502<br />
1995–96 -4 356 -1 157 11 -2 681 1 648 690 5 042 804<br />
2000–01 -6 292 -3 091 1 262 -4 069 1 742 1 171 7 599 1 679<br />
Positive and negative factors driving these trends vary across the <strong>State</strong>s. Major factors<br />
influencing the direction <strong>of</strong> the overall impacts include:<br />
• Defence expenditures are the main reason behind the increase in the Northern<br />
Territory’s production impact. They also noticeably increase the Australian Capital<br />
Territory’s production effect, and reduce Victoria’s production effect.<br />
• <strong>Commonwealth</strong> final consumption expenditures, excluding Defence, are the main<br />
reason behind the increase in the Australian Capital Territory’s production effect and<br />
increase the Northern Territory’s welfare transfer. They significantly reduce Western<br />
Australia’s welfare and production effects, and increase these effects in Queensland<br />
and South Australia.<br />
• Taxes and royalties on petroleum production have caused net movements in<br />
production impacts in Victoria and Western Australia.<br />
• Personal income tax is the main reason for the decline in the Australian Capital<br />
Territory’s welfare transfer and also contributes significantly to net movements in<br />
other <strong>State</strong>s.<br />
• Company tax has caused net movements in New South Wales, Queensland,<br />
Western Australia, South Australia and Tasmania.<br />
• <strong>Commonwealth</strong> grants (including the GST) are the main reason behind the increase<br />
in the Northern Territory’s welfare transfer, and contribute substantially to the<br />
increase in its production impact. They have also caused net movements in South<br />
Australia and Tasmania, but have worked against net movements in Victoria and the<br />
Australian Capital Territory’s welfare transfer.<br />
FINAL REPORT [118]


