A Review of the Event Analysis of Systemic Teamwork Methodology
A Review of the Event Analysis of Systemic Teamwork Methodology
A Review of the Event Analysis of Systemic Teamwork Methodology
- No tags were found...
You also want an ePaper? Increase the reach of your titles
YUMPU automatically turns print PDFs into web optimized ePapers that Google loves.
HFIDTC/WP1.1.3/10<br />
Version 2/ 31 October 2005<br />
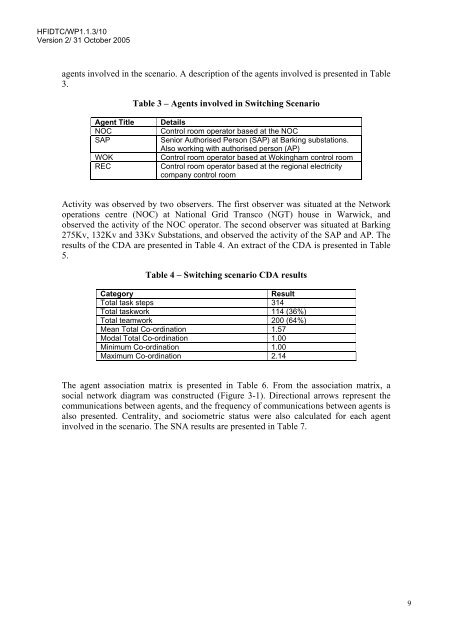
agents involved in <strong>the</strong> scenario. A description <strong>of</strong> <strong>the</strong> agents involved is presented in Table<br />
3.<br />
Table 3 – Agents involved in Switching Scenario<br />
Agent Title<br />
NOC<br />
SAP<br />
WOK<br />
REC<br />
Details<br />
Control room operator based at <strong>the</strong> NOC<br />
Senior Authorised Person (SAP) at Barking substations.<br />
Also working with authorised person (AP)<br />
Control room operator based at Wokingham control room<br />
Control room operator based at <strong>the</strong> regional electricity<br />
company control room<br />
Activity was observed by two observers. The first observer was situated at <strong>the</strong> Network<br />
operations centre (NOC) at National Grid Transco (NGT) house in Warwick, and<br />
observed <strong>the</strong> activity <strong>of</strong> <strong>the</strong> NOC operator. The second observer was situated at Barking<br />
275Kv, 132Kv and 33Kv Substations, and observed <strong>the</strong> activity <strong>of</strong> <strong>the</strong> SAP and AP. The<br />
results <strong>of</strong> <strong>the</strong> CDA are presented in Table 4. An extract <strong>of</strong> <strong>the</strong> CDA is presented in Table<br />
5.<br />
Table 4 – Switching scenario CDA results<br />
Category<br />
Result<br />
Total task steps 314<br />
Total taskwork 114 (36%)<br />
Total teamwork 200 (64%)<br />
Mean Total Co-ordination 1.57<br />
Modal Total Co-ordination 1.00<br />
Minimum Co-ordination 1.00<br />
Maximum Co-ordination 2.14<br />
The agent association matrix is presented in Table 6. From <strong>the</strong> association matrix, a<br />
social network diagram was constructed (Figure 3-1). Directional arrows represent <strong>the</strong><br />
communications between agents, and <strong>the</strong> frequency <strong>of</strong> communications between agents is<br />
also presented. Centrality, and sociometric status were also calculated for each agent<br />
involved in <strong>the</strong> scenario. The SNA results are presented in Table 7.<br />
9


