Final Technical Report - weADAPT
Final Technical Report - weADAPT
Final Technical Report - weADAPT
- No tags were found...
You also want an ePaper? Increase the reach of your titles
YUMPU automatically turns print PDFs into web optimized ePapers that Google loves.
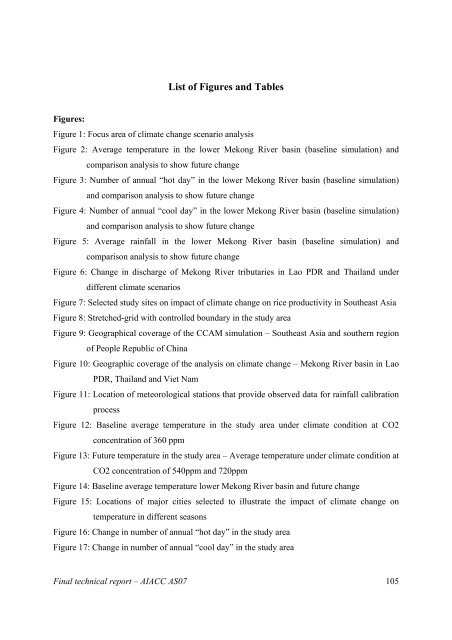
List of Figures and Tables<br />
Figures:<br />
Figure 1: Focus area of climate change scenario analysis<br />
Figure 2: Average temperature in the lower Mekong River basin (baseline simulation) and<br />
comparison analysis to show future change<br />
Figure 3: Number of annual “hot day” in the lower Mekong River basin (baseline simulation)<br />
and comparison analysis to show future change<br />
Figure 4: Number of annual “cool day” in the lower Mekong River basin (baseline simulation)<br />
and comparison analysis to show future change<br />
Figure 5: Average rainfall in the lower Mekong River basin (baseline simulation) and<br />
comparison analysis to show future change<br />
Figure 6: Change in discharge of Mekong River tributaries in Lao PDR and Thailand under<br />
different climate scenarios<br />
Figure 7: Selected study sites on impact of climate change on rice productivity in Southeast Asia<br />
Figure 8: Stretched-grid with controlled boundary in the study area<br />
Figure 9: Geographical coverage of the CCAM simulation – Southeast Asia and southern region<br />
of People Republic of China<br />
Figure 10: Geographic coverage of the analysis on climate change – Mekong River basin in Lao<br />
PDR, Thailand and Viet Nam<br />
Figure 11: Location of meteorological stations that provide observed data for rainfall calibration<br />
process<br />
Figure 12: Baseline average temperature in the study area under climate condition at CO2<br />
concentration of 360 ppm<br />
Figure 13: Future temperature in the study area – Average temperature under climate condition at<br />
CO2 concentration of 540ppm and 720ppm<br />
Figure 14: Baseline average temperature lower Mekong River basin and future change<br />
Figure 15: Locations of major cities selected to illustrate the impact of climate change on<br />
temperature in different seasons<br />
Figure 16: Change in number of annual “hot day” in the study area<br />
Figure 17: Change in number of annual “cool day” in the study area<br />
<strong>Final</strong> technical report – AIACC AS07 105


