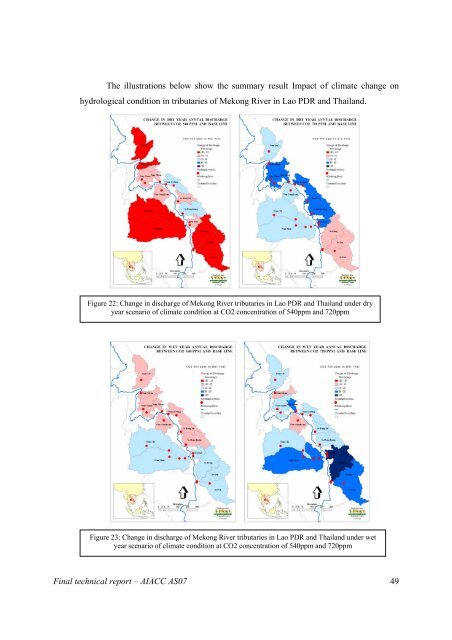
The result from the simulation shows that most of the tributaries of Mekong River in Lao PDR and Thailand tend to have more water in the future due to higher precipitation. For the wet year scenario, almost every watershed will have higher discharge under the climate condition at CO 2 concentration of 540 ppm and increase further under the climate condition at CO 2 concentration of 720 ppm. However, in the dry year scenario, many sub-basins will have slightly less water under climate condition at CO 2 concentration of 540 ppm, but the discharge will increase under the climate condition at CO 2 concentration of 720 ppm. Change in the discharge of Mekong River’s tributary under influence of climate change is summarized in the table below: Mekong River’s tributary Lao PDR Impact of Climate Change on Water Resource in Mekong River’s tributaries in Lao PDR and Thailand Wet Year Scenario: Tributary catchment’s Dry Year Scenario: Tributary catchment’s discharge under climate condition at different discharge under climate condition at CO 2 CO 2 concentration different concentration Baseline: 360 ppm (million m 3 ) 540 ppm (% change from baseline) 720 ppm (% change from baseline) Baseline: 360 ppm (million m 3 ) 540 ppm (% change from baseline) 720 ppm (% change from baseline) Nam Ou 11,458 +7.23% +16.78% 9,035 -15.56% +24.38% Nam Khan 1,293 +6.65% +6.93% 946 -11.17% +44.80% Upper Nam 3,820 +14.77% +8.44% 2,891 -12.30% +51.49% Ngum (before dam) Nam Ngum 14,837 +6.83% +11.79% 11,837 +4.70% +46.63% Nam Nhiep 4,796 +4.70% +46.63% 3,902 -4.00% +33.28% Nam Theun 39,427 -5.86% +18.75% 31,483 +11.03% +30.47% Se Bang Fai 8,330 -4.54% +14.92% 6,412 +1.40% +32.69% Se Bang 10,057 +0.04% +27.95% 6,784 +10.60% +51.21% Hieng Se Done 2,574 +13.30% +100.05% 1,829 +2.91% +53.43% Se Kong 37,506 +20.20% +63.21% 35,138 -13.64% +5.57% Se Son 14,279 +24.74% +51.75% 13,303 -11.60% +1.84% Se Pok 13,050 +22.39% +51.26% 12,382 -15.29% -3.53% Thailand Nam 12,270 +6.34% +7.41% 11,750 +7.18 +24.98 Songkram Nam Chi 6,423 +12.73% +21.27% 7,788 -10.24 +14.43 Nam Mun 18,645 +10.02% +34.06% 21,232 -15.01 +15.39 Table 8: Impact of climate change on discharge of Mekong River’s tributaries in Lao PDR and Thailand <strong>Final</strong> technical report – AIACC AS07 48
The illustrations below show the summary result Impact of climate change on hydrological condition in tributaries of Mekong River in Lao PDR and Thailand. Figure 22: Change in discharge of Mekong River tributaries in Lao PDR and Thailand under dry year scenario of climate condition at CO2 concentration of 540ppm and 720ppm Figure 23: Change in discharge of Mekong River tributaries in Lao PDR and Thailand under wet year scenario of climate condition at CO2 concentration of 540ppm and 720ppm <strong>Final</strong> technical report – AIACC AS07 49