

Vietnam Population and AIDS Indicator Survey 2005 ... - Measure DHS
Vietnam Population and AIDS Indicator Survey 2005 ... - Measure DHS
Vietnam Population and AIDS Indicator Survey 2005 ... - Measure DHS

Create successful ePaper yourself
Turn your PDF publications into a flip-book with our unique Google optimized e-Paper software.
asset information was collected in the VPAIS Household Questionnaire <strong>and</strong> covers information on<br />
household ownership of a number of consumer items ranging from a television to a bicycle or car, as well<br />
as dwelling characteristics such as source of drinking water, type of sanitation facilities, <strong>and</strong> type of<br />
materials used in dwelling construction.<br />
Each asset was assigned a weight (factor score) generated through principal component analysis,<br />
<strong>and</strong> the resulting asset scores were st<strong>and</strong>ardized in relation to a st<strong>and</strong>ard normal distribution with a mean<br />
of zero <strong>and</strong> st<strong>and</strong>ard deviation of one (Gwatkin et al., 2000). Each household was then assigned a score<br />
for each asset, <strong>and</strong> the scores were summed for each household. Individuals were ranked according to the<br />
total score of the household in which they resided. The sample was then divided into quintiles from one<br />
(lowest wealth level) to five (highest wealth level).<br />
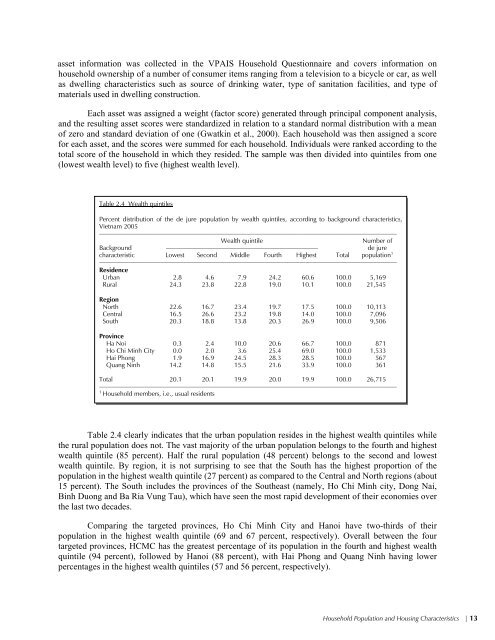
Table 2.4 Wealth quintiles<br />
Percent distribution of the de jure population by wealth quintiles, according to background characteristics,<br />
<strong>Vietnam</strong> <strong>2005</strong><br />
––––––––––––––––––––––––––––––––––––––––––––––––––––––––––––––––––––––––––––––––––––––––––––<br />
Wealth quintile<br />
Number of<br />
Background ––––––––––––––––––––––––––––––––––––––––––––––– de jure<br />
characteristic Lowest Second Middle Fourth Highest Total population 1<br />
––––––––––––––––––––––––––––––––––––––––––––––––––––––––––––––––––––––––––––––––––––––––––––<br />
Residence<br />
Urban 2.8 4.6 7.9 24.2 60.6 100.0 5,169<br />
Rural 24.3 23.8 22.8 19.0 10.1 100.0 21,545<br />
Region<br />
North 22.6 16.7 23.4 19.7 17.5 100.0 10,113<br />
Central 16.5 26.6 23.2 19.8 14.0 100.0 7,096<br />
South 20.3 18.8 13.8 20.3 26.9 100.0 9,506<br />
Province<br />
Ha Noi 0.3 2.4 10.0 20.6 66.7 100.0 871<br />
Ho Chi Minh City 0.0 2.0 3.6 25.4 69.0 100.0 1,533<br />
Hai Phong 1.9 16.9 24.5 28.3 28.5 100.0 567<br />
Quang Ninh 14.2 14.8 15.5 21.6 33.9 100.0 361<br />
Total 20.1 20.1 19.9 20.0 19.9 100.0 26,715<br />
––––––––––––––––––––––––––––––––––––––––––––––––––––––––––––––––––––––––––––––––––––––––––––<br />
1<br />
Household members, i.e., usual residents<br />
Table 2.4 clearly indicates that the urban population resides in the highest wealth quintiles while<br />
the rural population does not. The vast majority of the urban population belongs to the fourth <strong>and</strong> highest<br />
wealth quintile (85 percent). Half the rural population (48 percent) belongs to the second <strong>and</strong> lowest<br />
wealth quintile. By region, it is not surprising to see that the South has the highest proportion of the<br />
population in the highest wealth quintile (27 percent) as compared to the Central <strong>and</strong> North regions (about<br />
15 percent). The South includes the provinces of the Southeast (namely, Ho Chi Minh city, Dong Nai,<br />
Binh Duong <strong>and</strong> Ba Ria Vung Tau), which have seen the most rapid development of their economies over<br />
the last two decades.<br />
Comparing the targeted provinces, Ho Chi Minh City <strong>and</strong> Hanoi have two-thirds of their<br />
population in the highest wealth quintile (69 <strong>and</strong> 67 percent, respectively). Overall between the four<br />
targeted provinces, HCMC has the greatest percentage of its population in the fourth <strong>and</strong> highest wealth<br />
quintile (94 percent), followed by Hanoi (88 percent), with Hai Phong <strong>and</strong> Quang Ninh having lower<br />
percentages in the highest wealth quintiles (57 <strong>and</strong> 56 percent, respectively).<br />
Household <strong>Population</strong> <strong>and</strong> Housing Characteristics | 13


![Obtaining Informed Consent for HIV Testing [QRS4] - Measure DHS](https://img.yumpu.com/49850117/1/190x245/obtaining-informed-consent-for-hiv-testing-qrs4-measure-dhs.jpg?quality=85)


