

Vietnam Population and AIDS Indicator Survey 2005 ... - Measure DHS
Vietnam Population and AIDS Indicator Survey 2005 ... - Measure DHS
Vietnam Population and AIDS Indicator Survey 2005 ... - Measure DHS

You also want an ePaper? Increase the reach of your titles
YUMPU automatically turns print PDFs into web optimized ePapers that Google loves.
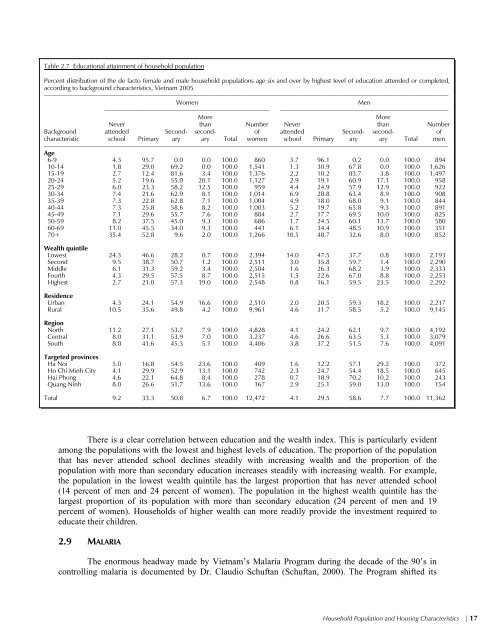
Table 2.7 Educational attainment of household population<br />
Percent distribution of the de facto female <strong>and</strong> male household populations age six <strong>and</strong> over by highest level of education attended or completed,<br />
according to background characteristics, <strong>Vietnam</strong> <strong>2005</strong><br />
–––––––––––––––––––––––––––––––––––––––––––––––––––––––––––––––––––––––––––––––––––––––––––––––––––––––––––––––––––––––––––––<br />
Women<br />
Men<br />
––––––––––––––––––––––––––––––––––––––––––––––––––– ––––––––––––––––––––––––––––––––––––––––––––––––––––<br />
More<br />
More<br />
Never than Number Never than Number<br />
Background attended Second- second- of attended Second- second- of<br />
characteristic school Primary ary ary Total women school Primary ary ary Total men<br />
–––––––––––––––––––––––––––––––––––––––––––––––––––––––––––––––––––––––––––––––––––––––––––––––––––––––––––––––––––––––––––––<br />
Age<br />
6-9 4.3 95.7 0.0 0.0 100.0 860 3.7 96.1 0.2 0.0 100.0 894<br />
10-14 1.8 29.0 69.2 0.0 100.0 1,541 1.3 30.9 67.8 0.0 100.0 1,626<br />
15-19 2.7 12.4 81.6 3.4 100.0 1,376 2.2 10.2 83.7 3.8 100.0 1,497<br />
20-24 5.2 19.6 55.0 20.1 100.0 1,127 2.9 19.1 60.9 17.1 100.0 958<br />
25-29 6.0 23.3 58.2 12.5 100.0 959 4.4 24.9 57.9 12.9 100.0 922<br />
30-34 7.4 21.6 62.9 8.1 100.0 1,014 6.9 20.8 63.4 8.9 100.0 908<br />
35-39 7.3 22.8 62.8 7.1 100.0 1,004 4.9 18.0 68.0 9.1 100.0 844<br />
40-44 7.3 25.8 58.6 8.2 100.0 1,003 5.2 19.7 65.8 9.3 100.0 891<br />
45-49 7.1 29.6 55.7 7.6 100.0 884 2.7 17.7 69.5 10.0 100.0 825<br />
50-59 8.2 37.5 45.0 9.3 100.0 686 1.7 24.5 60.1 13.7 100.0 580<br />
60-69 11.0 45.5 34.0 9.3 100.0 441 6.1 34.4 48.5 10.9 100.0 351<br />
70+ 35.4 52.8 9.6 2.0 100.0 1,266 10.5 48.7 32.6 8.0 100.0 852<br />
Wealth quintile<br />
Lowest 24.3 46.6 28.2 0.7 100.0 2,394 14.0 47.5 37.7 0.8 100.0 2,193<br />
Second 9.5 38.7 50.7 1.2 100.0 2,511 3.0 35.8 59.7 1.4 100.0 2,290<br />
Middle 6.1 31.3 59.2 3.4 100.0 2,504 1.6 26.3 68.2 3.9 100.0 2,333<br />
Fourth 4.3 29.5 57.5 8.7 100.0 2,515 1.5 22.6 67.0 8.8 100.0 2,253<br />
Highest 2.7 21.0 57.3 19.0 100.0 2,548 0.8 16.1 59.5 23.5 100.0 2,292<br />
Residence<br />
Urban 4.3 24.1 54.9 16.6 100.0 2,510 2.0 20.5 59.3 18.2 100.0 2,217<br />
Rural 10.5 35.6 49.8 4.2 100.0 9,961 4.6 31.7 58.5 5.2 100.0 9,145<br />
Region<br />
North 11.2 27.1 53.7 7.9 100.0 4,828 4.1 24.2 62.1 9.7 100.0 4,192<br />
Central 8.0 31.1 53.9 7.0 100.0 3,237 4.6 26.6 63.5 5.3 100.0 3,079<br />
South 8.0 41.6 45.3 5.1 100.0 4,406 3.8 37.2 51.5 7.6 100.0 4,091<br />
Targeted provinces<br />
Ha Noi 5.0 16.8 54.5 23.6 100.0 409 1.6 12.2 57.1 29.2 100.0 372<br />
Ho Chi Minh City 4.1 29.9 52.9 13.1 100.0 742 2.3 24.7 54.4 18.5 100.0 645<br />
Hai Phong 4.6 22.1 64.8 8.4 100.0 278 0.7 18.9 70.2 10.2 100.0 243<br />
Quang Ninh 8.0 26.6 51.7 13.6 100.0 167 2.9 25.1 59.0 13.0 100.0 154<br />
Total 9.2 33.3 50.8 6.7 100.0 12,472 4.1 29.5 58.6 7.7 100.0 11,362<br />
There is a clear correlation between education <strong>and</strong> the wealth index. This is particularly evident<br />
among the populations with the lowest <strong>and</strong> highest levels of education. The proportion of the population<br />
that has never attended school declines steadily with increasing wealth <strong>and</strong> the proportion of the<br />
population with more than secondary education increases steadily with increasing wealth. For example,<br />
the population in the lowest wealth quintile has the largest proportion that has never attended school<br />
(14 percent of men <strong>and</strong> 24 percent of women). The population in the highest wealth quintile has the<br />
largest proportion of its population with more than secondary education (24 percent of men <strong>and</strong> 19<br />
percent of women). Households of higher wealth can more readily provide the investment required to<br />
educate their children.<br />
2.9 MALARIA<br />
The enormous headway made by <strong>Vietnam</strong>’s Malaria Program during the decade of the 90’s in<br />
controlling malaria is documented by Dr. Claudio Schuftan (Schuftan, 2000). The Program shifted its<br />
Household <strong>Population</strong> <strong>and</strong> Housing Characteristics | 17


![Obtaining Informed Consent for HIV Testing [QRS4] - Measure DHS](https://img.yumpu.com/49850117/1/190x245/obtaining-informed-consent-for-hiv-testing-qrs4-measure-dhs.jpg?quality=85)


