

Vietnam Population and AIDS Indicator Survey 2005 ... - Measure DHS
Vietnam Population and AIDS Indicator Survey 2005 ... - Measure DHS
Vietnam Population and AIDS Indicator Survey 2005 ... - Measure DHS

Create successful ePaper yourself
Turn your PDF publications into a flip-book with our unique Google optimized e-Paper software.
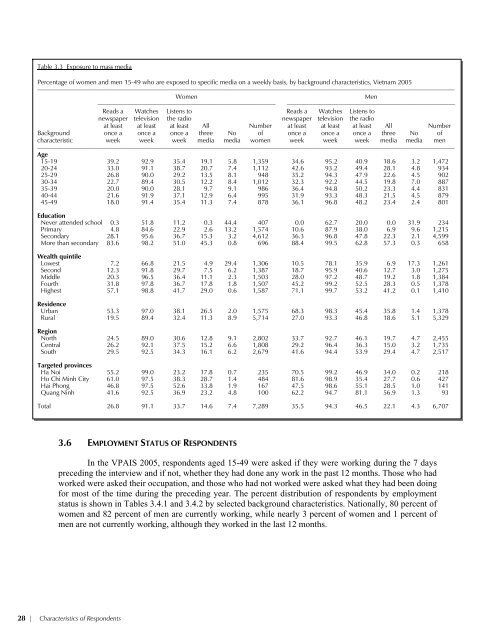
Table 3.3 Exposure to mass media<br />
Percentage of women <strong>and</strong> men 15-49 who are exposed to specific media on a weekly basis, by background characteristics, <strong>Vietnam</strong> <strong>2005</strong><br />
–––––––––––––––––––––––––––––––––––––––––––––––––––––––––––––––––––––––––––––––––––––––––––––––––––––––––––––––––––––––––––––––––<br />
Women<br />
Men<br />
––––––––––––––––––––––––––––––––––––––––––––––––––––––– ––––––––––––––––––––––––––––––––––––––––––––––––––––<br />
Reads a Watches Listens to Reads a Watches Listens to<br />
newspaper television the radio newspaper television the radio<br />
at least at least at least All Number at least at least at least All Number<br />
Background once a once a once a three No of once a once a once a three No of<br />
characteristic week week week media media women week week week media media men<br />
–––––––––––––––––––––––––––––––––––––––––––––––––––––––––––––––––––––––––––––––––––––––––––––––––––––––––––––––––––––––––––––––––<br />
Age<br />
15-19 39.2 92.9 35.4 19.1 5.8 1,359 34.6 95.2 40.9 18.6 3.2 1,472<br />
20-24 33.0 91.1 38.7 20.7 7.4 1,112 42.6 93.2 49.4 28.1 4.8 934<br />
25-29 26.8 90.0 29.2 13.5 8.1 948 35.2 94.3 47.9 22.6 4.5 902<br />
30-34 22.7 89.4 30.5 12.2 8.4 1,012 32.3 92.2 44.5 19.8 7.0 887<br />
35-39 20.0 90.0 28.1 9.7 9.1 986 36.4 94.8 50.2 23.3 4.4 831<br />
40-44 21.6 91.9 37.1 12.9 6.4 995 31.9 93.3 48.3 21.5 4.5 879<br />
45-49 18.0 91.4 35.4 11.3 7.4 878 36.1 96.8 48.2 23.4 2.4 801<br />
Education<br />
Never attended school 0.3 51.8 11.2 0.3 44.4 407 0.0 62.7 20.0 0.0 31.9 234<br />
Primary 4.8 84.6 22.9 2.6 13.2 1,574 10.6 87.9 38.0 6.9 9.6 1,215<br />
Secondary 28.1 95.6 36.7 15.3 3.2 4,612 36.3 96.8 47.8 22.3 2.1 4,599<br />
More than secondary 83.6 98.2 51.0 45.3 0.8 696 88.4 99.5 62.8 57.3 0.3 658<br />
Wealth quintile<br />
Lowest 7.2 66.8 21.5 4.9 29.4 1,306 10.5 78.1 35.9 6.9 17.3 1,261<br />
Second 12.3 91.8 29.7 7.5 6.2 1,387 18.7 95.9 40.6 12.7 3.0 1,275<br />
Middle 20.3 96.5 36.4 11.1 2.3 1,503 28.0 97.2 48.7 19.2 1.8 1,384<br />
Fourth 31.8 97.8 36.7 17.8 1.8 1,507 45.2 99.2 52.5 28.3 0.5 1,378<br />
Highest 57.1 98.8 41.7 29.0 0.6 1,587 71.1 99.7 53.2 41.2 0.1 1,410<br />
Residence<br />
Urban 53.3 97.0 38.1 26.5 2.0 1,575 68.3 98.3 45.4 35.8 1.4 1,378<br />
Rural 19.5 89.4 32.4 11.3 8.9 5,714 27.0 93.3 46.8 18.6 5.1 5,329<br />
Region<br />
North 24.5 89.0 30.6 12.8 9.1 2,802 33.7 92.7 46.1 19.7 4.7 2,455<br />
Central 26.2 92.1 37.5 15.2 6.6 1,808 29.2 96.4 36.3 15.0 3.2 1,735<br />
South 29.5 92.5 34.3 16.1 6.2 2,679 41.6 94.4 53.9 29.4 4.7 2,517<br />
Targeted provinces<br />
Ha Noi 55.2 99.0 23.2 17.8 0.7 235 70.5 99.2 46.9 34.0 0.2 218<br />
Ho Chi Minh City 61.0 97.5 38.3 28.7 1.4 484 81.6 98.9 35.4 27.7 0.6 427<br />
Hai Phong 46.8 97.5 52.6 33.8 1.9 167 47.5 98.6 55.1 28.5 1.0 141<br />
Quang Ninh 41.6 92.5 36.9 23.2 4.8 100 62.2 94.7 81.1 56.9 1.3 93<br />
Total 26.8 91.1 33.7 14.6 7.4 7,289 35.5 94.3 46.5 22.1 4.3 6,707<br />
3.6 EMPLOYMENT STATUS OF RESPONDENTS<br />
In the VPAIS <strong>2005</strong>, respondents aged 15-49 were asked if they were working during the 7 days<br />
preceding the interview <strong>and</strong> if not, whether they had done any work in the past 12 months. Those who had<br />
worked were asked their occupation, <strong>and</strong> those who had not worked were asked what they had been doing<br />
for most of the time during the preceding year. The percent distribution of respondents by employment<br />
status is shown in Tables 3.4.1 <strong>and</strong> 3.4.2 by selected background characteristics. Nationally, 80 percent of<br />
women <strong>and</strong> 82 percent of men are currently working, while nearly 3 percent of women <strong>and</strong> 1 percent of<br />
men are not currently working, although they worked in the last 12 months.<br />
28 | Characteristics of Respondents


![Obtaining Informed Consent for HIV Testing [QRS4] - Measure DHS](https://img.yumpu.com/49850117/1/190x245/obtaining-informed-consent-for-hiv-testing-qrs4-measure-dhs.jpg?quality=85)


