
Create successful ePaper yourself
Turn your PDF publications into a flip-book with our unique Google optimized e-Paper software.
5 Results Evaluation<br />
5.2 Result Diagrams<br />
The result diagram can be useful if you want to see a member's result distribution displayed<br />
graphically. Select the member (or set of members) in the <strong>RF</strong>-<strong>TIMBER</strong> <strong>Pro</strong> results table by<br />
placing the cursor in the corresponding table row and open the result diagram by clicking<br />
the button shown on the left. You find the button below the first table part of the results<br />
table (see Figure 5.1, page 45).<br />
The result diagrams are available in the <strong>RF</strong>EM graphic. To display the diagrams,<br />
select Result Diagrams on Selected Members on the Results menu,<br />
or use the button in the <strong>RF</strong>EM toolbar shown on the left.<br />
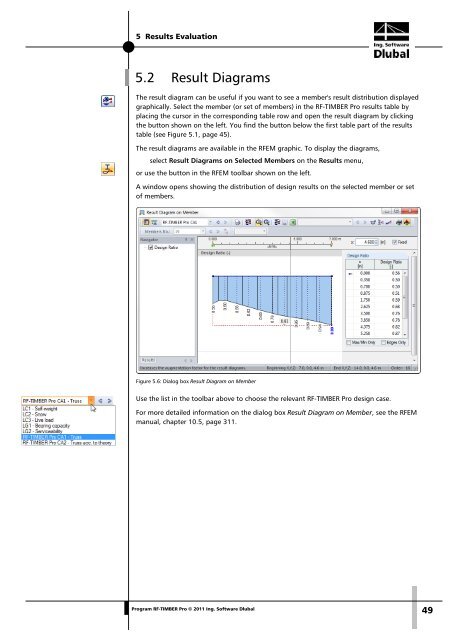
A window opens showing the distribution of design results on the selected member or set<br />
of members.<br />
Figure 5.6: Dialog box Result Diagram on Member<br />
Use the list in the toolbar above to choose the relevant <strong>RF</strong>-<strong>TIMBER</strong> <strong>Pro</strong> design case.<br />
For more detailed information on the dialog box Result Diagram on Member, see the <strong>RF</strong>EM<br />
manual, chapter 10.5, page 311.<br />
<strong>Pro</strong>gram <strong>RF</strong>-<strong>TIMBER</strong> <strong>Pro</strong> © 2011 Ing. <strong>Software</strong> <strong>Dlubal</strong><br />
49