PUC Annual ReportâFiscal Year 2011-12 - Public Utilities Commission
PUC Annual ReportâFiscal Year 2011-12 - Public Utilities Commission
PUC Annual ReportâFiscal Year 2011-12 - Public Utilities Commission

Create successful ePaper yourself
Turn your PDF publications into a flip-book with our unique Google optimized e-Paper software.
<strong>Public</strong> <strong>Utilities</strong> <strong>Commission</strong> <strong>Annual</strong> Report <strong>2011</strong>-<strong>12</strong><br />
State of Hawaii Page 88<br />
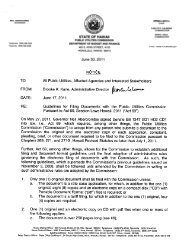
Figure 31. KIUC Average Service Availability (ASA) (High is better)<br />
100.000<br />
Percent<br />
99.990<br />
99.980<br />
99.970<br />
99.983 99.983<br />
99.980<br />
99.976<br />
99.960<br />
99.961<br />
99.950<br />
2007 2008 2009 2010 <strong>2011</strong><br />
<strong>Year</strong><br />
Figure 31 shows the Average System Availability (ASA) for the past five years.<br />
The <strong>2011</strong> ASA of 99.976 percent is slightly lower than the previous three years of the<br />
five-year period and equals the five-year average of 99.977 percent.<br />
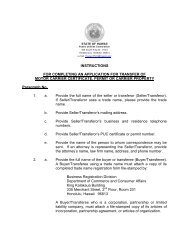
Figure 32. KIUC System Average Interruption Frequency Index (SAIF) (Lower is better)<br />
Interruptions<br />
10.00<br />
9.00<br />
8.00<br />
7.00<br />
6.00<br />
5.00<br />
4.00<br />
3.00<br />
2.00<br />
1.00<br />
0.00<br />
8.43<br />
6.17<br />
5.80<br />
4.45<br />
4.76<br />
2007 2008 2009 2010 <strong>2011</strong><br />
<strong>Year</strong>