PUC Annual ReportâFiscal Year 2011-12 - Public Utilities Commission
PUC Annual ReportâFiscal Year 2011-12 - Public Utilities Commission
PUC Annual ReportâFiscal Year 2011-12 - Public Utilities Commission

Create successful ePaper yourself
Turn your PDF publications into a flip-book with our unique Google optimized e-Paper software.
<strong>Public</strong> <strong>Utilities</strong> <strong>Commission</strong> <strong>Annual</strong> Report <strong>2011</strong>-<strong>12</strong><br />
State of Hawaii Page 84<br />
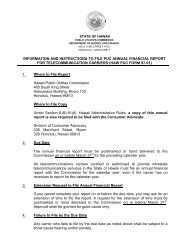
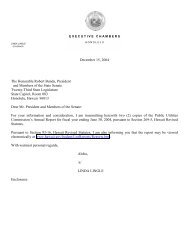
Figure 27. MECO System Average Interruption Duration (SAIDI) (Lower is better)<br />
250.00<br />
MECO SAIDI (Minutes)<br />
200.00<br />
150.00<br />
100.00<br />
50.00<br />
0.00<br />
219.10<br />
162.13<br />
102.38<br />
155.17<br />
53.41<br />
<strong>12</strong>8.55<br />
2006* 2007* 2008* 2009* 2010* <strong>2011</strong>*<br />
YEAR<br />
Note: *Data normalized for 2006, 2007, 2008, 2009, 2010 & <strong>2011</strong><br />
Figure 27 shows the System Average Interruption Duration Index (SAIDI) for the<br />
past six years. It shows that in <strong>2011</strong>, the recorded SAIDI index was <strong>12</strong>8.55 and it had<br />
increased from 2010 by 140.69 percent.<br />
The SAIDI is the composite of both the SAIFI and CAIDI indices and produces a<br />
broader benchmark of system reliability by combining both the duration and the number<br />
of customer interruptions during a given period of time. The higher SAIDI result was<br />
due to an increase in the SAIFI and CAIDI statistics as noted previously.<br />
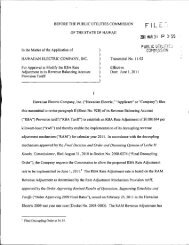
Figure 28. MECO System Average Interruption Frequency (SAIFI) (Lower is better)<br />
4.5<br />
MECO SAIFI (Interruptions)<br />
4.0<br />
3.5<br />
3.0<br />
2.5<br />
2.0<br />
1.5<br />
1.0<br />
0.5<br />
0.0<br />
3.874<br />
2.593<br />
1.614<br />
1.489<br />
1.134<br />
1.001<br />
2006* 2007* 2008* 2009* 2010* <strong>2011</strong>*<br />
YEAR<br />
Note: *Data normalized for 2006, 2007, 2008, 2009, 2010 & <strong>2011</strong>