PUC Annual ReportâFiscal Year 2011-12 - Public Utilities Commission
PUC Annual ReportâFiscal Year 2011-12 - Public Utilities Commission
PUC Annual ReportâFiscal Year 2011-12 - Public Utilities Commission

You also want an ePaper? Increase the reach of your titles
YUMPU automatically turns print PDFs into web optimized ePapers that Google loves.
<strong>Public</strong> <strong>Utilities</strong> <strong>Commission</strong> <strong>Annual</strong> Report <strong>2011</strong>-<strong>12</strong><br />
State of Hawaii Page 80<br />
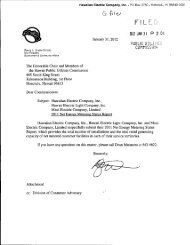
Figure 24. HELCO Customer Average Interruption Duration (CAID) (Lower is better)<br />
90.00<br />
80.00<br />
77.73<br />
70.00<br />
60.00<br />
60.46<br />
71.11<br />
63.10<br />
57.59 59.06<br />
Minutes<br />
50.00<br />
40.00<br />
30.00<br />
57.80<br />
58.62<br />
Normalized CAID<br />
48.05<br />
49.66<br />
41.19<br />
49.99<br />
20.00<br />
Not Normalized CAID<br />
10.00<br />
0.00<br />
2006 2007 2008 2009 2010 <strong>2011</strong><br />
<strong>Year</strong><br />
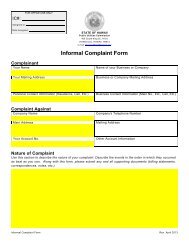
Figure 25. HELCO Average Service Availability (ASA) (Higher is better)<br />
100.000<br />
99.990<br />
Percent<br />
99.980<br />
99.970<br />
99.960<br />
99.971<br />
99.961<br />
99.973 99.972<br />
99.973<br />
99.965<br />
99.970<br />
99.967<br />
99.966<br />
99.950<br />
99.940<br />
99.950<br />
99.955<br />
Normalized ASA<br />
Not Normalized ASA<br />
99.946<br />
99.930<br />
2006 2007 2008 2009 2010 <strong>2011</strong><br />
<strong>Year</strong>