PUC Annual ReportâFiscal Year 2011-12 - Public Utilities Commission
PUC Annual ReportâFiscal Year 2011-12 - Public Utilities Commission
PUC Annual ReportâFiscal Year 2011-12 - Public Utilities Commission

You also want an ePaper? Increase the reach of your titles
YUMPU automatically turns print PDFs into web optimized ePapers that Google loves.
<strong>Public</strong> <strong>Utilities</strong> <strong>Commission</strong> <strong>Annual</strong> Report <strong>2011</strong>-<strong>12</strong><br />
State of Hawaii Page 59<br />
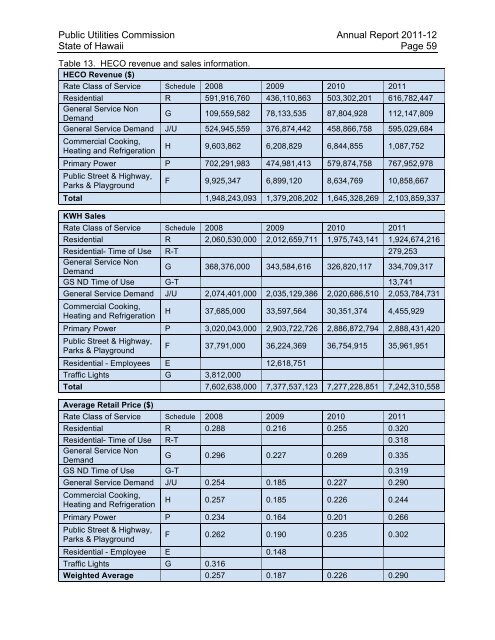
Table 13. HECO revenue and sales information.<br />
HECO Revenue ($)<br />
Rate Class of Service Schedule 2008 2009 2010 <strong>2011</strong><br />
Residential R 591,916,760 436,110,863 503,302,201 616,782,447<br />
General Service Non<br />
Demand<br />
G 109,559,582 78,133,535 87,804,928 1<strong>12</strong>,147,809<br />
General Service Demand J/U 524,945,559 376,874,442 458,866,758 595,029,684<br />
Commercial Cooking,<br />
Heating and Refrigeration<br />
H 9,603,862 6,208,829 6,844,855 1,087,752<br />
Primary Power P 702,291,983 474,981,413 579,874,758 767,952,978<br />
<strong>Public</strong> Street & Highway,<br />
Parks & Playground<br />
F 9,925,347 6,899,<strong>12</strong>0 8,634,769 10,858,667<br />
Total 1,948,243,093 1,379,208,202 1,645,328,269 2,103,859,337<br />
KWH Sales<br />
Rate Class of Service Schedule 2008 2009 2010 <strong>2011</strong><br />
Residential R 2,060,530,000 2,0<strong>12</strong>,659,711 1,975,743,141 1,924,674,216<br />
Residential- Time of Use R-T 279,253<br />
General Service Non<br />
Demand<br />
G 368,376,000 343,584,616 326,820,117 334,709,317<br />
GS ND Time of Use G-T 13,741<br />
General Service Demand J/U 2,074,401,000 2,035,<strong>12</strong>9,386 2,020,686,510 2,053,784,731<br />
Commercial Cooking,<br />
Heating and Refrigeration<br />
H 37,685,000 33,597,564 30,351,374 4,455,929<br />
Primary Power P 3,020,043,000 2,903,722,726 2,886,872,794 2,888,431,420<br />
<strong>Public</strong> Street & Highway,<br />
Parks & Playground<br />
F 37,791,000 36,224,369 36,754,915 35,961,951<br />
Residential - Employees E <strong>12</strong>,618,751<br />
Traffic Lights G 3,8<strong>12</strong>,000<br />
Total 7,602,638,000 7,377,537,<strong>12</strong>3 7,277,228,851 7,242,310,558<br />
Average Retail Price ($)<br />
Rate Class of Service Schedule 2008 2009 2010 <strong>2011</strong><br />
Residential R 0.288 0.216 0.255 0.320<br />
Residential- Time of Use R-T 0.318<br />
General Service Non<br />
Demand<br />
G 0.296 0.227 0.269 0.335<br />
GS ND Time of Use G-T 0.319<br />
General Service Demand J/U 0.254 0.185 0.227 0.290<br />
Commercial Cooking,<br />
Heating and Refrigeration<br />
H 0.257 0.185 0.226 0.244<br />
Primary Power P 0.234 0.164 0.201 0.266<br />
<strong>Public</strong> Street & Highway,<br />
Parks & Playground<br />
F 0.262 0.190 0.235 0.302<br />
Residential - Employee E 0.148<br />
Traffic Lights G 0.316<br />
Weighted Average 0.257 0.187 0.226 0.290