

BAE-annual-report-2014
BAE-annual-report-2014
BAE-annual-report-2014

You also want an ePaper? Increase the reach of your titles
YUMPU automatically turns print PDFs into web optimized ePapers that Google loves.
Strategic Report<br />
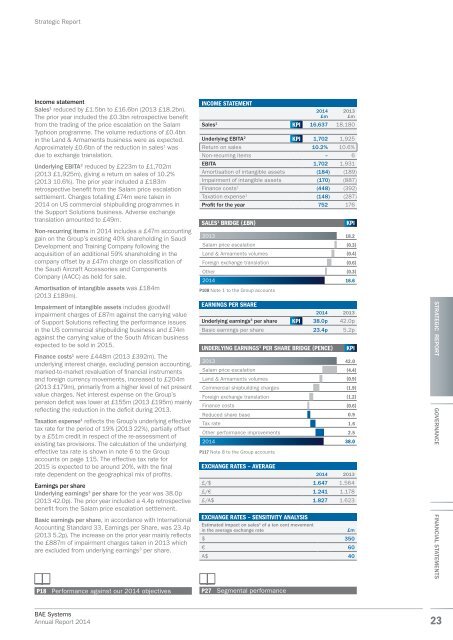
Income statement<br />
Sales 1 reduced by £1.5bn to £16.6bn (2013 £18.2bn).<br />
The prior year included the £0.3bn retrospective benefit<br />
from the trading of the price escalation on the Salam<br />
Typhoon programme. The volume reductions of £0.4bn<br />
in the Land & Armaments business were as expected.<br />
Approximately £0.6bn of the reduction in sales 1 was<br />
due to exchange translation.<br />
Underlying EBITA 2 reduced by £223m to £1,702m<br />
(2013 £1,925m), giving a return on sales of 10.2%<br />
(2013 10.6%). The prior year included a £183m<br />
retrospective benefit from the Salam price escalation<br />
settlement. Charges totalling £74m were taken in<br />
<strong>2014</strong> on US commercial shipbuilding programmes in<br />
the Support Solutions business. Adverse exchange<br />
translation amounted to £49m.<br />
Non-recurring items in <strong>2014</strong> includes a £47m accounting<br />
gain on the Group’s existing 40% shareholding in Saudi<br />
Development and Training Company following the<br />
acquisition of an additional 59% shareholding in the<br />
company offset by a £47m charge on classification of<br />
the Saudi Aircraft Accessories and Components<br />
Company (AACC) as held for sale.<br />
Amortisation of intangible assets was £184m<br />
(2013 £189m).<br />
Impairment of intangible assets includes goodwill<br />
impairment charges of £87m against the carrying value<br />
of Support Solutions reflecting the performance issues<br />
in the US commercial shipbuilding business and £74m<br />
against the carrying value of the South African business<br />
expected to be sold in 2015.<br />
Finance costs 1 were £448m (2013 £392m). The<br />
underlying interest charge, excluding pension accounting,<br />
marked-to-market revaluation of financial instruments<br />
and foreign currency movements, increased to £204m<br />
(2013 £179m), primarily from a higher level of net present<br />
value charges. Net interest expense on the Group’s<br />
pension deficit was lower at £155m (2013 £195m) mainly<br />
reflecting the reduction in the deficit during 2013.<br />
Taxation expense 1 reflects the Group’s underlying effective<br />
tax rate for the period of 19% (2013 22%), partially offset<br />
by a £51m credit in respect of the re-assessment of<br />
existing tax provisions. The calculation of the underlying<br />
effective tax rate is shown in note 6 to the Group<br />
accounts on page 115. The effective tax rate for<br />
2015 is expected to be around 20%, with the final<br />
rate dependent on the geographical mix of profits.<br />
Earnings per share<br />
Underlying earnings 3 per share for the year was 38.0p<br />
(2013 42.0p). The prior year included a 4.4p retrospective<br />
benefit from the Salam price escalation settlement.<br />
Basic earnings per share, in accordance with International<br />
Accounting Standard 33, Earnings per Share, was 23.4p<br />
(2013 5.2p). The increase on the prior year mainly reflects<br />
the £887m of impairment charges taken in 2013 which<br />
are excluded from underlying earnings 3 per share.<br />
INCOME STATEMENT<br />
<strong>2014</strong><br />
£m<br />
2013<br />
£m<br />
Sales 1 KPI 16,637 18,180<br />
Underlying EBITA 2 KPI 1,702 1,925<br />
Return on sales 10.2% 10.6%<br />
Non-recurring items – 6<br />
EBITA 1,702 1,931<br />
Amortisation of intangible assets (184) (189)<br />
Impairment of intangible assets (170) (887)<br />
Finance costs 1 (448) (392)<br />
Taxation expense 1 (148) (287)<br />
Profit for the year 752 176<br />
SALES 1 BRIDGE (£BN)<br />
2013<br />
Salam price escalation<br />
Land & Armaments volumes<br />
Foreign exchange translation<br />
Other<br />
<strong>2014</strong><br />
P108 Note 1 to the Group accounts<br />
EARNINGS PER SHARE<br />
KPI<br />
18.2<br />
(0.3)<br />
(0.4)<br />
(0.6)<br />
(0.3)<br />
16.6<br />
<strong>2014</strong> 2013<br />
Underlying earnings 3 per share KPI 38.0p 42.0p<br />
Basic earnings per share 23.4p 5.2p<br />
UNDERLYING EARNINGS 3 PER SHARE BRIDGE (PENCE)<br />
2013<br />
Salam price escalation<br />
Land & Armaments volumes<br />
Commercial shipbuilding charges<br />
Foreign exchange translation<br />
Finance costs<br />
Reduced share base<br />
Tax rate<br />
Other performance improvements<br />
<strong>2014</strong><br />
P117 Note 8 to the Group accounts<br />
KPI<br />
42.0<br />
(4.4)<br />
(0.9)<br />
(1.9)<br />
(1.2)<br />
(0.6)<br />
0.9<br />
1.6<br />
2.5<br />
38.0<br />
EXCHANGE RATES – AVERAGE<br />
<strong>2014</strong> 2013<br />
£/$ 1.647 1.564<br />
£/€ 1.241 1.178<br />
£/A$ 1.827 1.623<br />
EXCHANGE RATES – SENSITIVITY ANALYSIS<br />
Estimated impact on sales 1 of a ten cent movement<br />
in the average exchange rate £m<br />
$ 350<br />
€ 60<br />
A$ 40<br />
STRATEGIC REPORT GOVERNANCE FINANCIAL STATEMENTS<br />
P18 Performance against our <strong>2014</strong> objectives<br />
P27 Segmental performance<br />
<strong>BAE</strong> Systems<br />
Annual Report <strong>2014</strong><br />
23