Final Baseline Hydrology Report - October 2012 - Urban Drainage ...
Final Baseline Hydrology Report - October 2012 - Urban Drainage ...
Final Baseline Hydrology Report - October 2012 - Urban Drainage ...

You also want an ePaper? Increase the reach of your titles
YUMPU automatically turns print PDFs into web optimized ePapers that Google loves.
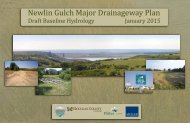
Sanderson Gulch Major <strong>Drainage</strong>way Plan<br />
<strong>Baseline</strong> <strong>Hydrology</strong> <strong>Report</strong> <strong>October</strong> <strong>2012</strong><br />
3.2.2 Basin Parameters<br />
All basin parameters were left unchanged from the 1972 MDP with the exception of soil infiltration loss<br />
which was changed to Horton’s Equation because an unknown method was used in the 1972 MDP. The<br />
infiltration coefficients used in the 1972 MDP were 0.75 inch/hour and an extra loss of 5 percent. These<br />
are not applicable to Horton’s Equation and cannot be used in the current model. Soils in the portion of<br />
the watershed within the City of Lakewood consist primarily of Hydrologic Soil Group (HSG) C, as defined<br />
by the NRCS. There is no Hydrologic Soil Group information available for the City and County of Denver.<br />
The City and County of Denver Storm <strong>Drainage</strong> Master Plan (Matrix, June 2009) assumed Type C soils<br />
and this assumption was adopted for the <strong>2012</strong> Sanderson Gulch MDP. Figure B-1 in Appendix B shows<br />
the distribution of soil types within the watershed. Initial and final infiltration rates and Horton’s decay rate<br />
were determined using Table RO-7 in the UDFCD-USDCM. For HSG C soils, the initial infiltration rate<br />
was 3.0 inches per hour, the final infiltration rate was 0.5 inches per hour. The decay coefficient was<br />
calibrated to 0.00111.<br />
3.2.3 Detention Pond Routing<br />
Stage-storage-discharge curves for detention ponds within the watershed from the 1972 MDP were found<br />
to not match the results reported in the 1972 MDP. For calibration purposes, the curves were adjusted so<br />
that they produced the same pond discharges as the 1972 MDP for given inflows. Calibrated detention<br />
pond inflow and outflow hydrographs are presented in Appendix B, Figure B-2.<br />
3.2.4 Results Before Calibration<br />
Revised subbasin delineations, updated infiltration and detention pond stage-storage curves were<br />
incorporated into the modeling using the most current versions of CUHP and EPA SWMM. Modeling<br />
results before calibration of results are shown in Column B of Table B-1 in Appendix B.<br />
3.2.5 Calibration of Duplicate Hydrologic Model<br />
The final step in creating the Duplicate Hydrologic Model was to calibrate runoff results to match as<br />
closely as possible the 1972 MDP results. Calibration was done by adjusting the basin parameter C p and<br />
the decay coefficient in Horton’s infiltration equation. The calibrated Duplicate Hydrologic Model results<br />
are shown in the Column C of Table B-1 in Appendix B.<br />
3.3 Corrected (<strong>Baseline</strong>) Hydrologic Model<br />
Starting with the Duplicate Hydrologic Model, the following additional steps were carried out to develop a<br />
final Corrected (<strong>Baseline</strong>) Hydrologic Model.<br />
• Rainfall depths and distributions were updated to be in accordance with current criteria.<br />
• Basin imperviousness was updated to correspond to current conditions and criteria.<br />
• Stage-storage discharge information for each detention pond in the watershed was updated.<br />
The Sanderson Gulch watershed is fully developed with the exception of the 152-acre Green Gables<br />
Country Club. Green Gables is currently being redeveloped from an open space golf course to a mixed-use<br />
commercial and residential site. Because Green Gables constitutes only a small fraction of the Sanderson<br />
Gulch watershed, developing separate existing and future conditions models as is typical for most UDFCD<br />
watershed master plans was not deemed necessary. Only a future conditions model was developed for this<br />
study which includes the immanent redevelopment of Green Gables.<br />
All analysis for the Corrected (<strong>Baseline</strong>) Hydrologic Model has been carried out in accordance with the April<br />
2008 revision of the UDFCD-USDCM and is documented in the following sections.<br />
3.3.1 Design Rainfall<br />
Rainfall depth and distribution has been updated to current UDFCD-USDCM criteria for use in the<br />
Corrected (<strong>Baseline</strong>) Hydrologic Model. Rainfall duration and depth-area reduction factors (DARF’s)<br />
applied to point rainfall depths used within CUHP vary with the size of the watershed being analyzed. The<br />
total contributing drainage area at the outfall of Sanderson Gulch to the South Platte River is 7.6 square<br />
miles. For watersheds less than 10 square miles, the UDFCD-USDCM stipulates that the 1-hour point<br />
precipitation depth be used and that no reduction in that depth for area be applied.<br />
The one-hour point rainfall depths for the 2-, 5-, 10-, 25-, 50- and 100-year events were read from Figures<br />
RA-1 through RA-6 in the UDFCD-USDCM. Figure B-3 in Appendix B shows the watershed boundary<br />
on the isopluvial map for the 100-year, 1-hour event. Selected point rainfall depths for this and the other<br />
design events are given in Table 3-2 below. Point rainfall data from the previous 1972 MDP study is<br />
also shown in Table 3-2 for comparison. Table B-2 in Appendix B presents 1972 MDP point rainfall<br />
values and associated basins.<br />
Table 3-2 One-Hour Point Rainfall Depths (Inches)<br />
<strong>2012</strong> Sanderson Gulch MDP Update (Matrix)<br />
2-Year 5-Year 10-Year 25-Year 50-Year 100-Year<br />
0.98 1.4 1.65 2.01 2.3 2.57<br />
1. Point rainfall depths are read from Figure RA-1 through RA-6 of USDCM.<br />
1972 Sanderson Gulch MDP (Frasier & Gingery, Inc.)<br />
Rainfall varies by sub-basin within the watershed<br />
2-Year 5-Year 10-Year 25-Year 50-Year 100-Year<br />
0.67-0.79 - 1.35 - 1.74 - - 2.00 - 2.26<br />
The Sanderson Gulch watershed is 7.6 square miles and the UDFCD-USDCM requires the use of a 2-<br />
hour storm for watersheds less than 10 square miles. Table RA-2 in the UDFCD-USDCM was used to<br />
convert 1-hour point rainfall depths to the required 2-hour storm depth and distribution. Table B-3 in<br />
Appendix B shows a comparison of the 2-hour rainfall distribution from the 1972 MDP and that derived<br />
from the most current UDFCD-USDCM.<br />
The Sanderson Gulch watershed is partially located within the City and County of Denver and partially<br />
within the City of Lakewood and Jefferson County. Rainfall depth criteria differ somewhat in the<br />
respective criteria manuals for Denver, Lakewood and UDFCD. A comparison of 1-hour and 2-hour storm<br />
rainfall between the three different criteria is shown on the Table B-4 in Appendix B. The UDFCD-<br />
USDCM one-hour point rainfall depths are slightly higher than those recommended in The City and<br />
28