Final Baseline Hydrology Report - October 2012 - Urban Drainage ...
Final Baseline Hydrology Report - October 2012 - Urban Drainage ...
Final Baseline Hydrology Report - October 2012 - Urban Drainage ...

You also want an ePaper? Increase the reach of your titles
YUMPU automatically turns print PDFs into web optimized ePapers that Google loves.
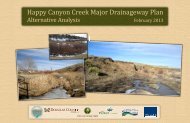
Sanderson Gulch Major <strong>Drainage</strong>way Plan<br />
<strong>Baseline</strong> <strong>Hydrology</strong> <strong>Report</strong> <strong>October</strong> <strong>2012</strong><br />
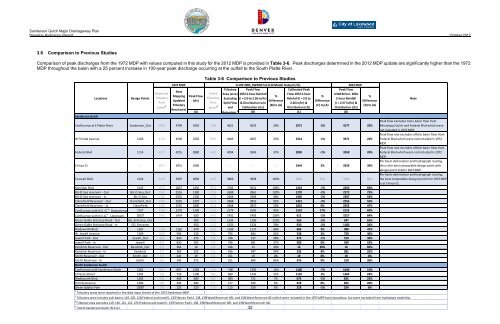
3.6 Comparison to Previous Studies<br />
Comparison of peak discharges from the 1972 MDP with values computed in this study for the <strong>2012</strong> MDP is provided in Table 3-6. Peak discharges determined in the <strong>2012</strong> MDP update are significantly higher than the 1972<br />
MDP throughout the basin with a 25 percent increase in 100-year peak discharge occurring at the outfall to the South Platte River.<br />
Sanderson Gulch<br />
Locations<br />
Peak Flow<br />
(cfs)<br />
Table 3-6 Comparison to Previous Studies<br />
32<br />
Peak Flow<br />
USDCM Ver. 2001<br />
2-hour Rainfall<br />
(I = 2.57 in/hr) &<br />
Distribution (cfs)<br />
Confluence at S Platte River Sanderson_Out 4900 4749 3350 5168 4621 4023 20% 3271 -2% 4177 25%<br />
Peak flow excludes trans-basin flow from<br />
Mississippi Gulch and Federal Blvd which were<br />
not included in 1972 MDP.<br />
W Florida Avenue 1106 4716 4549 3250 4950 4403 4007 23% 3214 -1% 3971 22%<br />
Peak flow rate excludes offsite basin flow from<br />
Federal Blvd which were not included in 1972<br />
MDP.<br />
Federal Blvd 1114 4377 4215 2880 4641 4094 3945 37% 2850 -1% 3558 24%<br />
Peak flow rate excludes offsite basin flow from<br />
Federal Blvd which were not included in 1972<br />
MDP.<br />
S Knox Ct - 3971 3951 2400 - - - - 2444 2% 3329 39%<br />
Per basin delineation and hydrograph routing,<br />
this is the best comparable design point with<br />
design point 1124 in <strong>2012</strong> MDP.<br />
S Lowell Blvd 1124 3439 3397 1830 4046 3806 3838 110% 2444 34% 3329 82%<br />
Per basin delineation and hydrograph routing,<br />
the best comparable design point from 1972 MDP<br />
is at S Knox Ct.<br />
Sheridan Blvd 1145 2870 2837 1450 2933 2783 3031 109% 1352 -7% 2450 69%<br />
Bit-O-Sea reservoir - Out Bit-O-Sea_Out 2580 2555 1300 2758 2608 2861 120% 1270 -2% 2272 75%<br />
Bit-O-Sea reservoir - In Bit-O-Sea 2580 2555 1500 2758 2608 2968 98% 1465 -2% 2307 54%<br />
Clairefield Reservoir - Out Clairefield_Out 2580 2555 1470 2618 2468 2816 92% 1431 -3% 2256 53%<br />
Clairefield Reservoir - In Clairefield 2580 2555 1800 2618 2468 2870 59% 1801 0% 2653 47%<br />
Confluence with N.S. G. 4 - Downstream 1157 2298 2270 1330 2179 2179 2595 95% 1553 17% 2125 60%<br />
Confluence with N.S.G. 4 - Upstream 1162T 1435 1414 620 1431 1431 1403 126% 612 -1% 1017 64%<br />
Green Gable Entrance Road - Out GG_Entrance_Out - - 580 1335 1335 1296 123% 569 -2% 947 63%<br />
Green Gable Entrance Road - In GG_Entrance - - 950 1335 1335 1324 39% 930 -2% 1180 24%<br />
Wadsworth Blvd. 1167 1178 1162 670 1169 1169 1127 68% 683 2% 988 47%<br />
W. Jewell Avenue 1169 1009 994 520 976 976 844 62% 528 2% 729 40%<br />
Jewell Park - Out Jewell_Out 840 820 375 746 746 517 38% 372 -1% 519 38%<br />
Jewell Park - In Jewell 840 820 505 746 746 641 27% 503 0% 599 19%<br />
Kendrick Reservoir - Out Kendrick_Out 373 363 10 416 416 13 30% 13 30% 16 60%<br />
Kendrick Reservoir - In Kendrick 373 363 225 416 416 347 54% 235 4% 281 25%<br />
Smith Reservoir - Out Smith_Out 255 245 19 251 251 19 0% 19 0% 19 0%<br />
Smith Reservoir - In Smith 255 245 375 251 251 694 85% 376 0% 510 36%<br />
North Sanderson Gulch<br />
Confluence with Sanderson Gulch 1201 863 857 1250 748 748 1392 11% 1166 -7% 1440 15%<br />
S Pierce Street 1202 728 718 1100 699 699 1345 22% 1110 1% 1364 24%<br />
Wadsworth Blvd. 1205 408 406 680 384 384 725 7% 676 -1% 835 23%<br />
Florida Avenue 1206 298 296 480 277 277 509 6% 478 0% 605 26%<br />
Green Gables Park 1208T 136 125 220 113 113 230 5% 218 -1% 234 6%<br />
1 Tributary areas were reported in the data input sheets of the 1972 Sanderson MDP.<br />
2 Tributary area includes sub-basins 119, 120, 121(Federal and Jewell), 137(Harvey Park), 138, 139(Ward Reservoir #5), and 156(Ward Reservoir #1) which were included in the 1972 MDP basin boundary, but were excluded from hydrologic modeling.<br />
3 Tributary area excludes 119, 120, 121, 122, 123 (Federal and Jewell), 137(Harvey Park), 138, 139(Ward Reservoir #5), and 156(Ward Reservoir #1).<br />
4 North Sanderson Gulch (N.S.G.)<br />
Design Points<br />
<strong>Report</strong>ed<br />
Tributary<br />
Area<br />
(acre) 1<br />
1972 MDP<br />
New<br />
Mapping<br />
Updated<br />
Tributary<br />
Area (acre)<br />
CUHP 2005_SWMM 5.0.0.22 Model Output (cfs)<br />
Tributary Peak Flow<br />
Calibrated Peak<br />
Entire Area (acre) 1972 2-hour Rainfall<br />
Flow 1972 2-hour<br />
%<br />
%<br />
Tributary Excluding (I = 2.0 to 2.26 in/hr)<br />
Rainfall (I = 2.0 to<br />
Difference<br />
Difference<br />
Area Split Flow & Distribution w/o<br />
2.26 in/hr) &<br />
(B) to (A)<br />
(C) to (A)<br />
(acre) 2 and Calibration (cfs)<br />
Distribution (cfs)<br />
(A) Retention 3 (B) (C) (D)<br />
<strong>2012</strong> MDP<br />
%<br />
Difference<br />
(D) to (A)<br />
Note