Final Baseline Hydrology Report - October 2012 - Urban Drainage ...
Final Baseline Hydrology Report - October 2012 - Urban Drainage ...
Final Baseline Hydrology Report - October 2012 - Urban Drainage ...

Create successful ePaper yourself
Turn your PDF publications into a flip-book with our unique Google optimized e-Paper software.
1601 Blake Street, Suite 200<br />
Denver, Colorado 80202<br />
(p) 303.572.0200<br />
(f) 303.572.0202<br />
www.matrixdesigngroup.com<br />
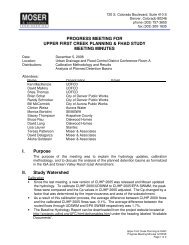
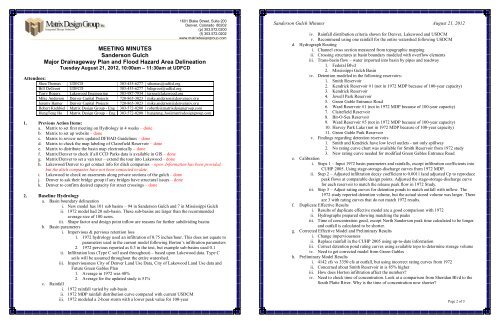
MEETING MINUTES<br />
Sanderson Gulch<br />
Major <strong>Drainage</strong>way Plan and Flood Hazard Area Delineation<br />
Tuesday August 21, <strong>2012</strong>, 10:00am – 11:30am at UDFCD<br />
Attendees:<br />
Shea Thomas UDFCD 303-455-6277 sthomas@udfcd.org<br />
Bill DeGroot UDFCD 303-455-6277 bdegroot@udfcd.org<br />
Terry Rogers Lakewood Engineering 303-987-7934 terrog@lakewood.org<br />
Mike Anderson Denver Capital Projects 720-865-3023 mike.anderson@denvergov.org<br />
Jeremy Hamer Denver Capital Projects 720-865-3023 mike.anderson@denvergov.org<br />
Robert Krehbiel Matrix Design Group - Eng 303-572-0200 robertk@matrixdesigngroup.com<br />
HungTeng Ho Matrix Design Group – Eng 303-572-0200 hungteng_ho@matrixdesigngroup.com<br />
1. Previous Action Items:<br />
a. Matrix to set first meeting on <strong>Hydrology</strong> in 4 weeks – done<br />
b. Matrix to set up website – done<br />
c. Matrix to review new updated DFHAD Guidelines – done<br />
d. Matrix to check the map labeling of Clairefield Reservoir – done<br />
e. Matrix to distribute the basin map electronically – done<br />
f. Matrix/Denver to check if all CCD Parks data is available in GIS – done<br />
g. Matrix/Denver to set a van tour – extend the tour into Lakewood – done<br />
h. Lakewood/Denver to get contact info for ditch companies – open. Information has been provided,<br />
but the ditch companies have not been contacted to-date.<br />
i. Lakewood to check on easements along private sections of the gulch – done<br />
j. Denver to ask their bridge group if any bridges have structural issues – done<br />
k. Denver to confirm desired capacity for street crossings – done<br />
2. <strong>Baseline</strong> <strong>Hydrology</strong><br />
a. Basin boundary delineation<br />
i. New model has 101 sub basins – 94 in Sanderson Gulch and 7 in Mississippi Gulch<br />
ii. 1972 model had 20 sub-basin. These sub-basins are larger than the recommended<br />
average size of 100 acres.<br />
iii. Shape factor and design point inflow are reasons for further subdividing basins<br />
b. Basin parameters<br />
i. Impervious & pervious retention loss<br />
1. 1972 hydrology used an infiltration of 0.75 inches/hour. This does not equate to<br />
parameters used in the current model following Horton’s infiltration parameters<br />
2. 1972 pervious reported as 0.3 in the text, but example sub-basins used 0.1<br />
ii. Infiltration loss (Type C soil used throughout) – based upon Lakewood data. Type C<br />
soils will be assumed throughout the entire watershed.<br />
iii. Imperviousness City of Denver Land Use Data, City of Lakewood Land Use data and<br />
Future Green Gables Plan<br />
1. Average in 1972 was 40%<br />
2. Average for the updated study is 51%<br />
c. Rainfall<br />
i. 1972 rainfall varied by sub-basin<br />
ii. 1972 MDP rainfall distribution curve compared with current USDCM<br />
iii. 1972 modeled a 2-hour storm with a lower peak value for 100-year<br />
Sanderson Gulch Minutes August 21, <strong>2012</strong><br />
iv. Rainfall distribution criteria shown for Denver, Lakewood and USDCM<br />
v. Recommend using one rainfall for the entire watershed following USDCM<br />
d. Hydrograph Routing<br />
i. Channel cross section measured from topographic mapping<br />
ii. Crossing structures at basin boundary modeled with overflow elements<br />
iii. Trans-basin flow – water imported into basin by pipes and roadway<br />
1. Federal Blvd<br />
2. Mississippi Gulch Basin<br />
iv. Detention modeled in the following reservoirs:<br />
1. Smith Reservoir<br />
2. Kendrick Reservoir #1 (not in 1972 MDP because of 100-year capacity)<br />
3. Kendrick Reservoir<br />
4. Jewell Park Reservoir<br />
5. Green Gable Entrance Road<br />
6. Ward Reservoir #1 (not in 1972 MDP because of 100-year capacity)<br />
7. Clairefield Reservoir<br />
8. Bit-O-Sea Reservoir<br />
9. Ward Reservoir #5 (not in 1972 MDP because of 100-year capacity)<br />
10. Harvey Park Lake (not in 1972 MDP because of 100-year capacity)<br />
11. Green Gable Park Reservoir<br />
v. Findings regarding detention reservoirs<br />
1. Smith and Kendrick have low level outlets - not only spillway<br />
2. No rating curve chart was available for Smith Reservoir from 1972 study<br />
3. New rating curve needed for modified Green Gables Entrance Road<br />
e. Calibration<br />
i. Steps 1 – Input 1972 basin parameters and rainfalls, except infiltration coefficients into<br />
CUHP 2005. Using stage-storage-discharge curves from 1972 MDP.<br />
ii. Step 2 – Adjusted infiltration decay coefficient to 0.00111and adjusted Cp to reproduce<br />
peak flows at comparable design points. Adjusted the stage-storage-discharge curve<br />
for each reservoir to match the release peak flow in 1972 Study.<br />
iii. Step 3 – Adjust rating curves for detention ponds to match outfall with inflow. The<br />
1972 study reported detention volume, but the actual stored volume was larger. There<br />
are 3 with rating curves that do not match 1972 results.<br />
f. Duplicate Effective Results<br />
i. Results of duplicate effective model are a good comparison with 1972<br />
ii. Hydrographs prepared showing matching the peaks<br />
iii. Time of concentration good, except North Sanderson peak time calculated to be longer<br />
and outfall is calculated to be shorter.<br />
g. Corrected Effective Model and Preliminary Results<br />
i. Change imperviousness<br />
ii. Replace rainfall in the CUHP 2005 using up-to-date information<br />
iii. Correct detention pond rating curves using available topo to determine storage volume<br />
iv. Need to get corrected model from Green Gables<br />
h. Preliminary Model Results<br />
i. 4142 cfs vs 3350 cfs at outfall, but using incorrect rating curves from 1972<br />
ii. Concerned about Smith Reservoir in is 85% higher<br />
iii. How does Horton infiltration affect the numbers?<br />
iv. Need to check time of concentration. Look at a comparison from Sheridan Blvd to the<br />
South Platte River. Why is the time of concentration now shorter?<br />
Page 2 of 3