FinPilot2 Final Report â User Acceptance of Mobile TV Services ...
FinPilot2 Final Report â User Acceptance of Mobile TV Services ...
FinPilot2 Final Report â User Acceptance of Mobile TV Services ...

You also want an ePaper? Increase the reach of your titles
YUMPU automatically turns print PDFs into web optimized ePapers that Google loves.
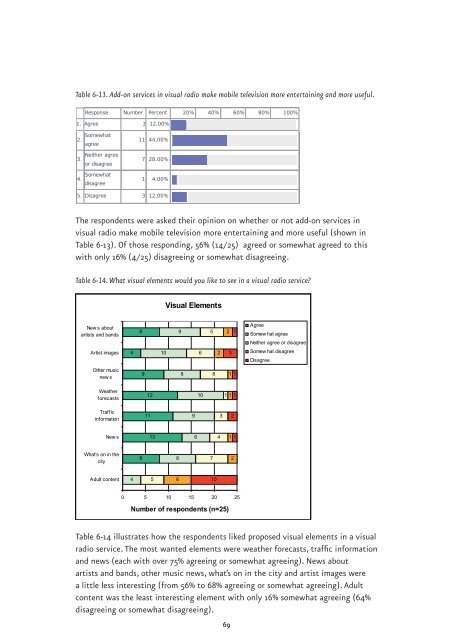
Table 6-13. Add-on services in visual radio make mobile television more entertaining and more useful.<br />
Response Number Percent 20% 40% 60% 80% 100%<br />
1. Agree 3 12,00%<br />
2. Somewhat<br />
agree<br />
Neither agree<br />
3.<br />
or disagree<br />
4. Somewhat<br />
disagree<br />
11 44,00%<br />
7 28,00%<br />
1 4,00%<br />
5. Disagree 3 12,00%<br />
The respondents were asked their opinion on whether or not add-on services in<br />
visual radio make mobile television more entertaining and more useful (shown in<br />
Table 6-13). Of those responding, 56% (14/25) agreed or somewhat agreed to this<br />
with only 16% (4/25) disagreeing or somewhat disagreeing.<br />
Table 6-14. What visual elements would you like to see in a visual radio service?<br />
Visual Elements<br />
New s about<br />
artists and bands<br />
8<br />
9<br />
5<br />
2<br />
1<br />
Agree<br />
Somew hat agree<br />
Neither agree or disagree<br />
Artist images<br />
4<br />
10<br />
6<br />
2<br />
3<br />
Somew hat disagree<br />
Disagree<br />
Other music<br />
new s<br />
9<br />
8<br />
6<br />
1 1<br />
Weather<br />
forecasts<br />
12<br />
10<br />
1 1 1<br />
Traffic<br />
information<br />
11<br />
9<br />
3<br />
2<br />
New s<br />
13<br />
6<br />
4<br />
1 1<br />
What's on in the<br />
city<br />
8<br />
8<br />
7<br />
2<br />
Adult content<br />
4<br />
5<br />
6<br />
10<br />
0 5 10 15 20 25<br />
Number <strong>of</strong> respondents (n=25)<br />
Table 6-14 illustrates how the respondents liked proposed visual elements in a visual<br />
radio service. The most wanted elements were weather forecasts, traffic information<br />
and news (each with over 75% agreeing or somewhat agreeing). News about<br />
artists and bands, other music news, what’s on in the city and artist images were<br />
a little less interesting (from 56% to 68% agreeing or somewhat agreeing). Adult<br />
content was the least interesting element with only 16% somewhat agreeing (64%<br />
disagreeing or somewhat disagreeing).<br />
69