FinPilot2 Final Report â User Acceptance of Mobile TV Services ...
FinPilot2 Final Report â User Acceptance of Mobile TV Services ...
FinPilot2 Final Report â User Acceptance of Mobile TV Services ...

Create successful ePaper yourself
Turn your PDF publications into a flip-book with our unique Google optimized e-Paper software.
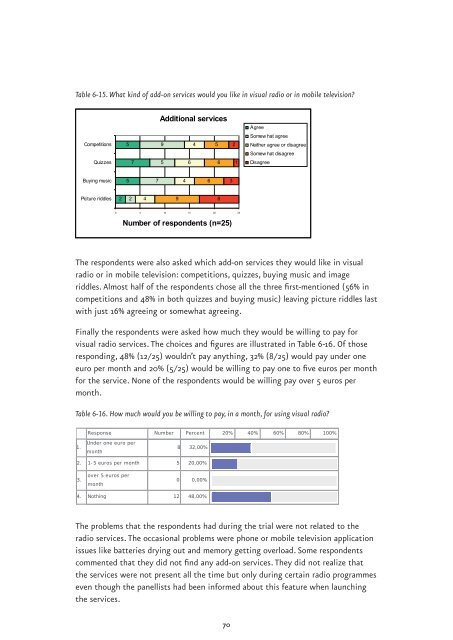
Table 6-15. What kind <strong>of</strong> add-on services would you like in visual radio or in mobile television?<br />
Additional services<br />
Agree<br />
Somew hat agree<br />
Competitions<br />
5<br />
9<br />
4<br />
5<br />
2<br />
Neither agree or disagree<br />
Somew hat disagree<br />
Quizzes<br />
7<br />
5<br />
6<br />
6<br />
1<br />
Disagree<br />
Buying music<br />
5<br />
7<br />
4<br />
6<br />
3<br />
Picture riddles<br />
2<br />
2<br />
4<br />
9<br />
8<br />
0 5 10 15 20 25<br />
Number <strong>of</strong> respondents (n=25)<br />
The respondents were also asked which add-on services they would like in visual<br />
radio or in mobile television: competitions, quizzes, buying music and image<br />
riddles. Almost half <strong>of</strong> the respondents chose all the three first-mentioned (56% in<br />
competitions and 48% in both quizzes and buying music) leaving picture riddles last<br />
with just 16% agreeing or somewhat agreeing.<br />
<strong>Final</strong>ly the respondents were asked how much they would be willing to pay for<br />
visual radio services. The choices and figures are illustrated in Table 6-16. Of those<br />
responding, 48% (12/25) wouldn’t pay anything, 32% (8/25) would pay under one<br />
euro per month and 20% (5/25) would be willing to pay one to five euros per month<br />
for the service. None <strong>of</strong> the respondents would be willing pay over 5 euros per<br />
month.<br />
Table 6-16. How much would you be willing to pay, in a month, for using visual radio?<br />
Response Number Percent 20% 40% 60% 80% 100%<br />
1.<br />
Under one euro per<br />
month<br />
8 32,00%<br />
2. 1-5 euros per month 5 20,00%<br />
3.<br />
over 5 euros per<br />
month<br />
0 0,00%<br />
4. Nothing 12 48,00%<br />
The problems that the respondents had during the trial were not related to the<br />
radio services. The occasional problems were phone or mobile television application<br />
issues like batteries drying out and memory getting overload. Some respondents<br />
commented that they did not find any add-on services. They did not realize that<br />
the services were not present all the time but only during certain radio programmes<br />
even though the panellists had been informed about this feature when launching<br />
the services.<br />
70