Republic of Montenegro: Public Expenditure and ... - Vlada Crne Gore
Republic of Montenegro: Public Expenditure and ... - Vlada Crne Gore
Republic of Montenegro: Public Expenditure and ... - Vlada Crne Gore

You also want an ePaper? Increase the reach of your titles
YUMPU automatically turns print PDFs into web optimized ePapers that Google loves.
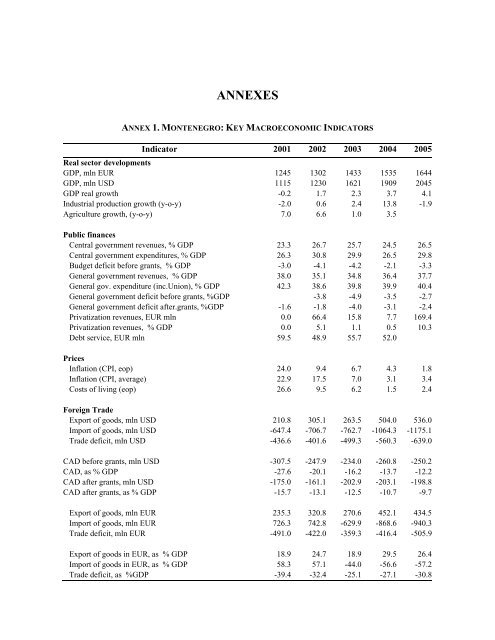
ANNEXES<br />
ANNEX 1. MONTENEGRO: KEY MACROECONOMIC INDICATORS<br />
Indicator 2001 2002 2003 2004 2005<br />
Real sector developments<br />
GDP, mln EUR 1245 1302 1433 1535 1644<br />
GDP, mln USD 1115 1230 1621 1909 2045<br />
GDP real growth -0.2 1.7 2.3 3.7 4.1<br />
Industrial production growth (y-o-y) -2.0 0.6 2.4 13.8 -1.9<br />
Agriculture growth, (y-o-y) 7.0 6.6 1.0 3.5<br />
<strong>Public</strong> finances<br />
Central government revenues, % GDP 23.3 26.7 25.7 24.5 26.5<br />
Central government expenditures, % GDP 26.3 30.8 29.9 26.5 29.8<br />
Budget deficit before grants, % GDP -3.0 -4.1 -4.2 -2.1 -3.3<br />
General government revenues, % GDP 38.0 35.1 34.8 36.4 37.7<br />
General gov. expenditure (inc.Union), % GDP 42.3 38.6 39.8 39.9 40.4<br />
General government deficit before grants, %GDP -3.8 -4.9 -3.5 -2.7<br />
General government deficit after.grants, %GDP -1.6 -1.8 -4.0 -3.1 -2.4<br />
Privatization revenues, EUR mln 0.0 66.4 15.8 7.7 169.4<br />
Privatization revenues, % GDP 0.0 5.1 1.1 0.5 10.3<br />
Debt service, EUR mln 59.5 48.9 55.7 52.0<br />
Prices<br />
Inflation (CPI, eop) 24.0 9.4 6.7 4.3 1.8<br />
Inflation (CPI, average) 22.9 17.5 7.0 3.1 3.4<br />
Costs <strong>of</strong> living (eop) 26.6 9.5 6.2 1.5 2.4<br />
Foreign Trade<br />
Export <strong>of</strong> goods, mln USD 210.8 305.1 263.5 504.0 536.0<br />
Import <strong>of</strong> goods, mln USD -647.4 -706.7 -762.7 -1064.3 -1175.1<br />
Trade deficit, mln USD -436.6 -401.6 -499.3 -560.3 -639.0<br />
CAD before grants, mln USD -307.5 -247.9 -234.0 -260.8 -250.2<br />
CAD, as % GDP -27.6 -20.1 -16.2 -13.7 -12.2<br />
CAD after grants, mln USD -175.0 -161.1 -202.9 -203.1 -198.8<br />
CAD after grants, as % GDP -15.7 -13.1 -12.5 -10.7 -9.7<br />
Export <strong>of</strong> goods, mln EUR 235.3 320.8 270.6 452.1 434.5<br />
Import <strong>of</strong> goods, mln EUR 726.3 742.8 -629.9 -868.6 -940.3<br />
Trade deficit, mln EUR -491.0 -422.0 -359.3 -416.4 -505.9<br />
Export <strong>of</strong> goods in EUR, as % GDP 18.9 24.7 18.9 29.5 26.4<br />
Import <strong>of</strong> goods in EUR, as % GDP 58.3 57.1 -44.0 -56.6 -57.2<br />
Trade deficit, as %GDP -39.4 -32.4 -25.1 -27.1 -30.8