Republic of Montenegro: Public Expenditure and ... - Vlada Crne Gore
Republic of Montenegro: Public Expenditure and ... - Vlada Crne Gore
Republic of Montenegro: Public Expenditure and ... - Vlada Crne Gore

Create successful ePaper yourself
Turn your PDF publications into a flip-book with our unique Google optimized e-Paper software.
12<br />
Chapter 2: Composition <strong>of</strong> <strong>Public</strong> <strong>Expenditure</strong> <strong>and</strong><br />
Key Sources <strong>of</strong> Fiscal Pressure<br />
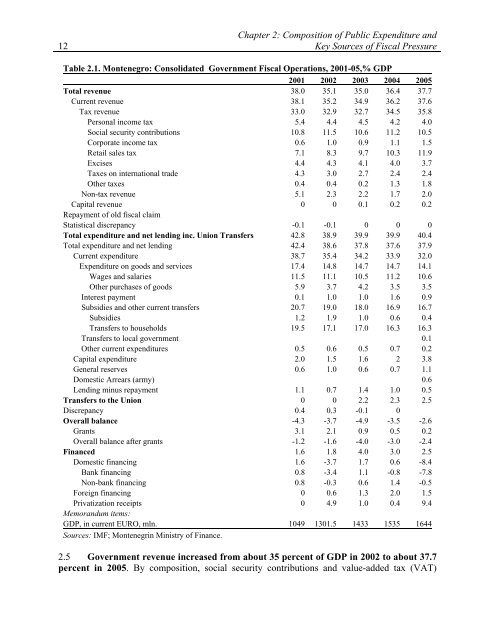
Table 2.1. <strong>Montenegro</strong>: Consolidated Government Fiscal Operations, 2001-05,% GDP<br />
2001 2002 2003 2004 2005<br />
Total revenue 38.0 35.1 35.0 36.4 37.7<br />
Current revenue 38.1 35.2 34.9 36.2 37.6<br />
Tax revenue 33.0 32.9 32.7 34.5 35.8<br />
Personal income tax 5.4 4.4 4.5 4.2 4.0<br />
Social security contributions 10.8 11.5 10.6 11.2 10.5<br />
Corporate income tax 0.6 1.0 0.9 1.1 1.5<br />
Retail sales tax 7.1 8.3 9.7 10.3 11.9<br />
Excises 4.4 4.3 4.1 4.0 3.7<br />
Taxes on international trade 4.3 3.0 2.7 2.4 2.4<br />
Other taxes 0.4 0.4 0.2 1.3 1.8<br />
Non-tax revenue 5.1 2.3 2.2 1.7 2.0<br />
Capital revenue 0 0 0.1 0.2 0.2<br />
Repayment <strong>of</strong> old fiscal claim<br />
Statistical discrepancy -0.1 -0.1 0 0 0<br />
Total expenditure <strong>and</strong> net lending inc. Union Transfers 42.8 38.9 39.9 39.9 40.4<br />
Total expenditure <strong>and</strong> net lending 42.4 38.6 37.8 37.6 37.9<br />
Current expenditure 38.7 35.4 34.2 33.9 32.0<br />
<strong>Expenditure</strong> on goods <strong>and</strong> services 17.4 14.8 14.7 14.7 14.1<br />
Wages <strong>and</strong> salaries 11.5 11.1 10.5 11.2 10.6<br />
Other purchases <strong>of</strong> goods 5.9 3.7 4.2 3.5 3.5<br />
Interest payment 0.1 1.0 1.0 1.6 0.9<br />
Subsidies <strong>and</strong> other current transfers 20.7 19.0 18.0 16.9 16.7<br />
Subsidies 1.2 1.9 1.0 0.6 0.4<br />
Transfers to households 19.5 17.1 17.0 16.3 16.3<br />
Transfers to local government 0.1<br />
Other current expenditures 0.5 0.6 0.5 0.7 0.2<br />
Capital expenditure 2.0 1.5 1.6 2 3.8<br />
General reserves 0.6 1.0 0.6 0.7 1.1<br />
Domestic Arrears (army) 0.6<br />
Lending minus repayment 1.1 0.7 1.4 1.0 0.5<br />
Transfers to the Union 0 0 2.2 2.3 2.5<br />
Discrepancy 0.4 0.3 -0.1 0<br />
Overall balance -4.3 -3.7 -4.9 -3.5 -2.6<br />
Grants 3.1 2.1 0.9 0.5 0.2<br />
Overall balance after grants -1.2 -1.6 -4.0 -3.0 -2.4<br />
Financed 1.6 1.8 4.0 3.0 2.5<br />
Domestic financing 1.6 -3.7 1.7 0.6 -8.4<br />
Bank financing 0.8 -3.4 1.1 -0.8 -7.8<br />
Non-bank financing 0.8 -0.3 0.6 1.4 -0.5<br />
Foreign financing 0 0.6 1.3 2.0 1.5<br />
Privatization receipts 0 4.9 1.0 0.4 9.4<br />
Memor<strong>and</strong>um items:<br />
GDP, in current EURO, mln. 1049 1301.5 1433 1535 1644<br />
Sources: IMF; Montenegrin Ministry <strong>of</strong> Finance.<br />
2.5 Government revenue increased from about 35 percent <strong>of</strong> GDP in 2002 to about 37.7<br />
percent in 2005. By composition, social security contributions <strong>and</strong> value-added tax (VAT)