Republic of Montenegro: Public Expenditure and ... - Vlada Crne Gore
Republic of Montenegro: Public Expenditure and ... - Vlada Crne Gore
Republic of Montenegro: Public Expenditure and ... - Vlada Crne Gore

You also want an ePaper? Increase the reach of your titles
YUMPU automatically turns print PDFs into web optimized ePapers that Google loves.
Chapter 2: Composition <strong>of</strong> <strong>Public</strong> <strong>Expenditure</strong><br />
<strong>and</strong> Key Sources <strong>of</strong> Fiscal Pressure 33<br />
continuing their education, were more likely than not to be unemployed a year later. This is true<br />
for every type <strong>of</strong> program but it is especially true for those who attended three year programs<br />
(<strong>and</strong> 80 percent <strong>of</strong> those who graduated from craft programs <strong>and</strong> 51 percent <strong>of</strong> those from ‘field<br />
<strong>of</strong> service’, which includes programs for the service sectors like tourism). What is especially<br />
worrying about these three-year programs is that those entering these are from poorer families:<br />
93 percent <strong>of</strong> those students in 3 year programs had parents with no university education,<br />
compared with only 63 percent in four year programs (the figure for ‘craft programs’ is an<br />
astonishing 96 percent). So these students are trapped in a cycle <strong>of</strong> poverty.<br />
2.51 In general, the prospects for secondary education graduates in the labor market are<br />
poor. This suggests that any skills they learn at school directly relevant for specific jobs are<br />
inadequate <strong>and</strong> likely to become obsolete due to the lack <strong>of</strong> use during unemployment after<br />
graduation (which could last some time—78 percent <strong>of</strong> the unemployed graduates in the survey<br />
were unemployed for the entire year after graduation). This conclusion is reinforced when one<br />
considers that 67 percent <strong>of</strong> graduates who are employed are employed in the service sector,<br />
where general skills are more highly valued (<strong>and</strong> training for the job takes less time).<br />
2.52 This leads to the conclusion that secondary school graduates are better <strong>of</strong>f with<br />
strong general education skills which will enable them to seek a wider range <strong>of</strong> employment,<br />
learn new skills quickly, <strong>and</strong> are less likely to ossify during spells <strong>of</strong> unemployment. This<br />
implies that a shift towards more general education studies would have stronger labor market<br />
outcomes – even for those who do not go to university. This would represent a dramatic shift in<br />
the way that secondary education is provided in <strong>Montenegro</strong>, where more than 30 percent <strong>of</strong> all<br />
students are in ‘field <strong>of</strong> service’ or craft programs, which <strong>of</strong>fer a very narrow curriculum focused<br />
around vocational skills. <strong>Montenegro</strong> has begun a reform <strong>of</strong> vocational education; usefully it is<br />
involving employers in the changes. The impact <strong>of</strong> this reform clearly needs to be measured.<br />
However, the reform focus is on enhancing the practical aspects <strong>of</strong> vocational education; as such,<br />
it is not likely to address the concerns raised here.<br />
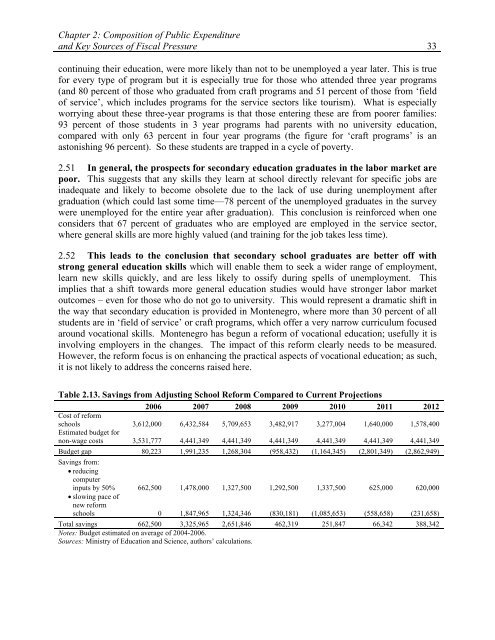
Table 2.13. Savings from Adjusting School Reform Compared to Current Projections<br />
2006 2007 2008 2009 2010 2011 2012<br />
Cost <strong>of</strong> reform<br />
schools 3,612,000 6,432,584 5,709,653 3,482,917 3,277,004 1,640,000 1,578,400<br />
Estimated budget for<br />
non-wage costs 3,531,777 4,441,349 4,441,349 4,441,349 4,441,349 4,441,349 4,441,349<br />
Budget gap 80,223 1,991,235 1,268,304 (958,432) (1,164,345) (2,801,349) (2,862,949)<br />
Savings from:<br />
• reducing<br />
computer<br />
inputs by 50% 662,500 1,478,000 1,327,500 1,292,500 1,337,500 625,000 620,000<br />
• slowing pace <strong>of</strong><br />
new reform<br />
schools 0 1,847,965 1,324,346 (830,181) (1,085,653) (558,658) (231,658)<br />
Total savings 662,500 3,325,965 2,651,846 462,319 251,847 66,342 388,342<br />
Notes: Budget estimated on average <strong>of</strong> 2004-2006.<br />
Sources: Ministry <strong>of</strong> Education <strong>and</strong> Science, authors’ calculations.