Republic of Montenegro: Public Expenditure and ... - Vlada Crne Gore
Republic of Montenegro: Public Expenditure and ... - Vlada Crne Gore
Republic of Montenegro: Public Expenditure and ... - Vlada Crne Gore

You also want an ePaper? Increase the reach of your titles
YUMPU automatically turns print PDFs into web optimized ePapers that Google loves.
Chapter 2: Composition <strong>of</strong> <strong>Public</strong> <strong>Expenditure</strong> <strong>and</strong><br />
Key Sources <strong>of</strong> Fiscal Pressure 19<br />
Education<br />
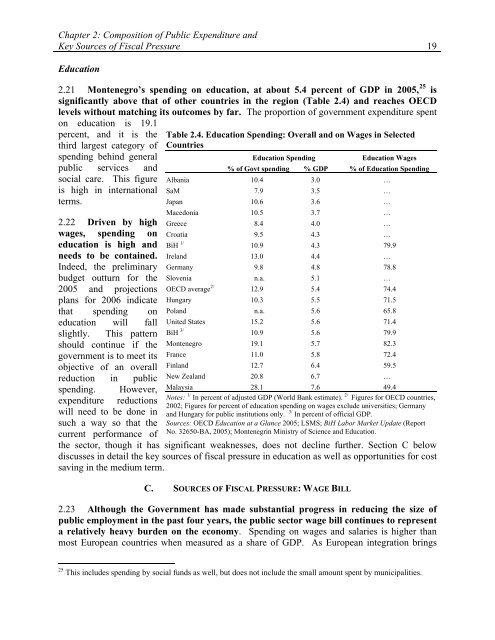
2.21 <strong>Montenegro</strong>’s spending on education, at about 5.4 percent <strong>of</strong> GDP in 2005, 25 is<br />
significantly above that <strong>of</strong> other countries in the region (Table 2.4) <strong>and</strong> reaches OECD<br />
levels without matching its outcomes by far. The proportion <strong>of</strong> government expenditure spent<br />
on education is 19.1<br />
percent, <strong>and</strong> it is the<br />
third largest category <strong>of</strong><br />
spending behind general<br />
public services <strong>and</strong><br />
social care. This figure<br />
is high in international<br />
terms.<br />
2.22 Driven by high<br />
wages, spending on<br />
education is high <strong>and</strong><br />
needs to be contained.<br />
Indeed, the preliminary<br />
budget outturn for the<br />
2005 <strong>and</strong> projections<br />
plans for 2006 indicate<br />
that spending on<br />
education will fall<br />
slightly. This pattern<br />
should continue if the<br />
government is to meet its<br />
objective <strong>of</strong> an overall<br />
reduction in public<br />
spending. However,<br />
expenditure reductions<br />
will need to be done in<br />
such a way so that the<br />
current performance <strong>of</strong><br />
Table 2.4. Education Spending: Overall <strong>and</strong> on Wages in Selected<br />
Countries<br />
Education Spending<br />
Education Wages<br />
% <strong>of</strong> Govt spending % GDP % <strong>of</strong> Education Spending<br />
Albania 10.4 3.0 …<br />
SaM 7.9 3.5 …<br />
Japan 10.6 3.6 …<br />
Macedonia 10.5 3.7 …<br />
Greece 8.4 4.0 …<br />
Croatia 9.5 4.3 …<br />
BiH 1/ 10.9 4.3 79.9<br />
Irel<strong>and</strong> 13.0 4.4 …<br />
Germany 9.8 4.8 78.8<br />
Slovenia n.a. 5.1 …<br />
OECD average 2/ 12.9 5.4 74.4<br />
Hungary 10.3 5.5 71.5<br />
Pol<strong>and</strong> n.a. 5.6 65.8<br />
United States 15.2 5.6 71.4<br />
BiH 3/ 10.9 5.6 79.9<br />
<strong>Montenegro</strong> 19.1 5.7 82.3<br />
France 11.0 5.8 72.4<br />
Finl<strong>and</strong> 12.7 6.4 59.5<br />
New Zeal<strong>and</strong> 20.8 6.7 …<br />
Malaysia 28.1 7.6 49.4<br />
Notes: 1/ In percent <strong>of</strong> adjusted GDP (World Bank estimate). 2/ Figures for OECD countries,<br />
2002; Figures for percent <strong>of</strong> education spending on wages exclude universities; Germany<br />
<strong>and</strong> Hungary for public institutions only. 3/ In percent <strong>of</strong> <strong>of</strong>ficial GDP.<br />
Sources: OECD Education at a Glance 2005; LSMS; BiH Labor Market Update (Report<br />
No. 32650-BA, 2005); Montenegrin Ministry <strong>of</strong> Science <strong>and</strong> Education.<br />
the sector, though it has significant weaknesses, does not decline further. Section C below<br />
discusses in detail the key sources <strong>of</strong> fiscal pressure in education as well as opportunities for cost<br />
saving in the medium term.<br />
C. SOURCES OF FISCAL PRESSURE: WAGE BILL<br />
2.23 Although the Government has made substantial progress in reducing the size <strong>of</strong><br />
public employment in the past four years, the public sector wage bill continues to represent<br />
a relatively heavy burden on the economy. Spending on wages <strong>and</strong> salaries is higher than<br />
most European countries when measured as a share <strong>of</strong> GDP. As European integration brings<br />
25 This includes spending by social funds as well, but does not include the small amount spent by municipalities.