

2008 Sector Performance Report - US Environmental Protection ...
2008 Sector Performance Report - US Environmental Protection ...
2008 Sector Performance Report - US Environmental Protection ...

You also want an ePaper? Increase the reach of your titles
YUMPU automatically turns print PDFs into web optimized ePapers that Google loves.
<strong>Sector</strong> Data<br />
Side by Side<br />
The following sections present sector data for several sectors<br />
together. Because the sectors vary so substantially in<br />
size, scope, makeup, data availability, relevant drivers and<br />
barriers, and numerous other factors, a direct-one-on-one<br />
comparison of their performance would be inappropriate.<br />
To consider energy-related air emissions, for example, a<br />
sound analysis should also include sector-specific information<br />
on fuel flexibility, which is driven by percentages<br />
of fuel used for energy or for raw materials and other<br />
considerations.<br />
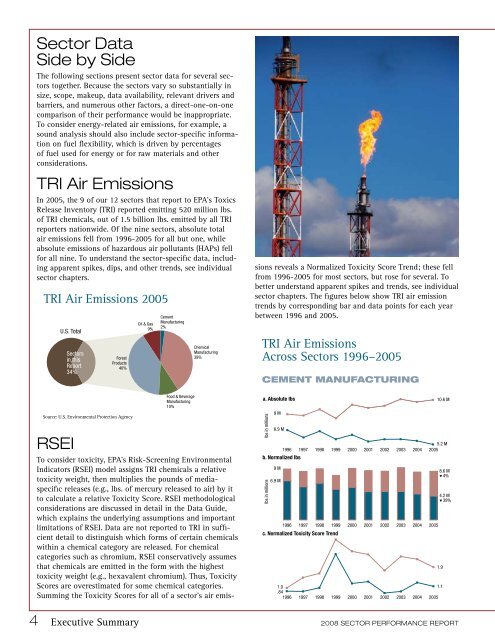
TRI Air Emissions<br />
In 2005, the 9 of our 12 sectors that report to EPA’s Toxics<br />
Release Inventory (TRI) reported emitting 520 million lbs.<br />
of TRI chemicals, out of 1.5 billion lbs. emitted by all TRI<br />
reporters nationwide. Of the nine sectors, absolute total<br />
air emissions fell from 1996-2005 for all but one, while<br />
absolute emissions of hazardous air pollutants (HAPs) fell<br />
TRI Air Emissions 2005<br />
U.S. Total<br />
Oil & Gas<br />
9%<br />
sions reveals a Normalized Toxicity Score Trend; these fell<br />
from 1996-2005 for most sectors, but rose for several. To<br />
better understand apparent spikes and trends, see individual<br />
sector chapters. The figures below show TRI air emission<br />
trends by corresponding bar and data points for each year<br />
Cement between 1996 and 2005.<br />
Manufacturing<br />
2%<br />
TRI Air Emissions<br />
<strong>Sector</strong>s<br />
in this Across <strong>Sector</strong>s 1996–2005<br />
<strong>Report</strong> 40%<br />
34%<br />
Chemical<br />
Manufacturing<br />
Forest 39%<br />
Products<br />
CEMENT MANUFACTURING<br />
Source: U.S. <strong>Environmental</strong> <strong>Protection</strong> Agency<br />
Food & Beverage<br />
Manufacturing<br />
10%<br />
a. Absolute lbs 10.6 M<br />
RSEI<br />
1996 1997 1998 1999 2000 2001 2002 2003 2004 20055.2 M<br />
for all nine. To understand the sector-specific data, includ-<br />
ing apparent spikes, dips, and other trends, see individual<br />
sector chapters.<br />
lbs in millions lbs in millions<br />
9 M<br />
6.9 M<br />
b. Normalized lbs<br />
To consider toxicity, EPA’s Risk-Screening <strong>Environmental</strong><br />
Indicators (RSEI) model assigns TRI chemicals a relative<br />
9 M<br />
8.6 M<br />
4%<br />
toxicity weight, then multiplies the pounds of media-<br />
6.9 M<br />
specific releases (e.g., lbs. of mercury released to air) by it<br />
to calculate a relative Toxicity Score. RSEI methodological<br />
4.2 M<br />
39%<br />
considerations are discussed in detail in the Data Guide,<br />
which explains the underlying assumptions and important<br />
limitations of RSEI. Data are not reported to TRI in suffic.<br />
1996 1997 1998 1999 2000 2001 2002 2003 2004 2005<br />
cient detail to distinguish which forms of certain chemicals<br />
Normalized Toxicity Score Trend<br />
within a chemical category are released. For chemical<br />
categories such as chromium, RSEI conservatively assumes<br />
that chemicals are emitted in the form with the highest 1.9<br />
toxicity weight (e.g., hexavalent chromium). Thus, Toxicity<br />
Scores are overestimated for some chemical categories. 1.0 1.1<br />
Summing the Toxicity Scores for all of a sector’s air emis-<br />
.84<br />
1996 1997 1998 1999 2000 2001 2002 2003 2004 2005<br />
4 Executive Summary <strong>2008</strong> SECTOR PERFORMANCE REPORT


