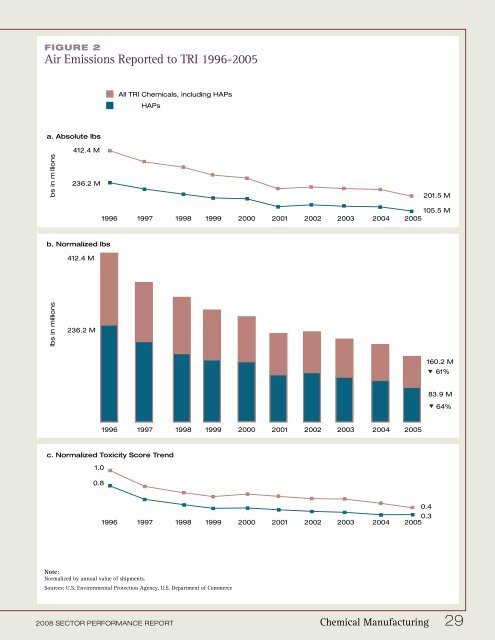
Chemical facilities purchase electricity and produce energy from a variety of fuels. Natural gas was the primary fuel that the sector used in 2002, as shown in Figure 1. Net electricity was the third largest source of power for the sector in 2002. Chemical manufacturers have opportunities for short- and long-term fuel switching, whereby they can reduce one energy source in favor of another with fewer emissions or greater efficiency. With the already high prices of natural gas, many facilities that can switch to alternative fuels from natural gas are already doing so. 6 Facilities could switch from emissions-intensive fuels, such as coal, to lower-emission fuels such as natural gas, but they have little cost incentive to do so; natural gas is more expensive than coal. Future energy consumption of all fuels is expected to increase in chemical manufacturing, and longterm fuel switching potential relies heavily on the price of natural gas. 7 Reducing Electricity Demand Sometimes the best alternative energy source is not a fuel. Hexion Specialty Chemical, Inc., of South Glens Falls, NY, realized a 21% reduction in electrical demand with no excess emissions when the facility installed a backpressure induction turbine generator powered by excess process steam. In addition to “free” energy, reductions in water usage and boiler treatment chemicals resulted as benefits of this pollution prevention project. 8 Cogeneration, or combined heat and power (CHP), increases energy efficiency through onsite production of thermal energy and electricity from a single fuel source. Cogeneration and self-generation of electricity are important in the chemical industry. The sector uses cogeneration to generate almost one third of the electricity it consumes. 9 Expanded application and further development offer the potential for additional opportunities in fuel switching and energy savings. Energy Cogeneration and Conservation In 1994, Dow committed to reducing the company’s global energy intensity by 20% by 2005. In 2005, Dow improved by 22% over 1994, reducing energy use by more than 370 trillion Btu. In 2006, Dow’s Freeport, TX, site replaced an older gas turbine with a more efficient steam generating plant and took other steps, such as switching to byproduct fuels, to reduce its energy intensity 2.6% relative to 2005, saving 3.6 trillion Btu and approximately $25 million. Overall, the company saved an estimated 5.4 trillion Btu of energy in 2006, with associated direct carbon dioxide (CO 2 ) emission reductions of 382,821 tons. 10 Plant Energy Reduction Program The DuPont Sabine River Works site, in Orange, TX, achieved major reductions in power generation and transmission using a data-driven approach to process improvement. Operators, supervisors, and engineers created an at-a-glance “dashboard” with data from numerous sources that compares optimal to actual performance, shows real-time cost impacts, and highlights underperforming processes. If improvements are needed, the dashboard lists recommended corrective actions, operating procedures, and diagnostic tools. Operators improved efficiency from 10% below expectations to 15% above, sometimes performing at the theoretical limit. Annualized energy savings have been 25%, with associated CO 2 emissions reductions of 10,962 tons. 11 Air Emissions Air emissions from the sector include criteria air pollutants (CAPs), greenhouse gases (GHGs), and a number of chemicals reported to EPA’s Toxics Release Inventory (TRI). In general, the “toxic chemicals” tracked by TRI are found in the raw materials or fuels used in chemical manufacturing processes, and as intermediates. They can also be byproducts, products from side reactions, or internal end products. CAPs and GHGs are also generated as combustion byproducts from onsite combustion of fuels. Air Emissions <strong>Report</strong>ed to TRI In 2005, 3,096 facilities in the Chemical Manufacturing sector reported 201 million absolute lbs. of air emissions. Between 1996 and 2005, absolute TRI-reported air emissions declined by 51%, as shown in Figure 2a. When normalized by the sector’s value of shipments over the period, air emissions decreased 61%, as seen in Figure 2b. 12 Facilitylevel analysis of TRI data indicate that this reduction was driven by a decline in the quantity of chemicals released by facilities that reported across all years, rather than being driven by a reduced number of reporters. To consider toxicity of air emissions, EPA’s Risk-Screening <strong>Environmental</strong> Indicators (RSEI) model assigns every TRI chemical a relative toxicity weight, then multiplies the pounds of media-specific releases (e.g., pounds of mercury released to air) by a chemical-specific toxicity weight to calculate a relative Toxicity Score. RSEI methodological considerations are discussed in greater detail in the Data Guide, which explains the underlying assumptions and important limitations of RSEI. Data are not reported to TRI in sufficient detail to distinguish which forms of certain chemicals within a chemical category are being emitted. For chemical categories such as chromium, the toxicity model 28 Chemical Manufacturing <strong>2008</strong> SECTOR PERFORMANCE REPORT
Figure 2 Air Emissions <strong>Report</strong>ed to TRI 1996-2005 All TRI Chemicals, including HAPs ll I C i l i l i g H All TRI HAPs Chem ll I H a. Absolute lbs l t l 412.4 lut Ms 12 bs in bs in m in m llions 236.2 M 236 2 201.5 M 201 5 105.5 201 5 M 1996 1997 1998 1999 2000 2001 2002 2003 2004 2005 b. Normalized lbs 412.4 M lbs lbs in in millions o 236.2 M 160.2 61 M 61% 83.9 M 64% 1996 1997 1998 1999 2000 2001 2002 2003 2004 2005 c. Normalized Toxicity Score Trend 1.0 0.8 0.3 1996 1997 1998 1999 2000 2001 2002 2003 2004 2005 0.4 Note: Normalized by annual value of shipments. Sources: U.S. <strong>Environmental</strong> <strong>Protection</strong> Agency, U.S. Department of Commerce <strong>2008</strong> SECTOR PERFORMANCE REPORT Chemical Manufacturing 29
- Page 1 and 2: 2008 Sector Performance rePort
- Page 3: table of Contents i Preface 1 Execu
- Page 6 and 7: Key to our work is collaboration wi
- Page 8 and 9: Energy Use The eight sectors for wh
- Page 10 and 11: Sector Data Side by Side The follow
- Page 12 and 13: TRI Air Emissions Across Sectors 19
- Page 14 and 15: TRI Waste Management Across Sectors
- Page 16 and 17: This report relies upon a variety o
- Page 18 and 19: TABLE 3 Economic Activity Data for
- Page 20 and 21: Presentation of TRI Air Emissions D
- Page 22 and 23: Presentation 500,000,000 of TRI Was
- Page 24 and 25: Cement Manufacturing 1 AT A GLANCE
- Page 26 and 27: equires 32% more energy per ton of
- Page 28 and 29: Summing the Toxicity Scores for all
- Page 30 and 31: l t , r t i t i Figure 3 Cement Kil
- Page 32 and 33: ChemiCal manufaCturing 1 AT A GLANC
- Page 36 and 37: conservatively assumes that chemica
- Page 38 and 39: Balanced Water Use at BASF Supply U
- Page 40 and 41: Waste Management Reported to TRI In
- Page 42 and 43: Colleges & universities 1 AT A GLAN
- Page 44 and 45: Criteria Air Pollutants Most CAP em
- Page 46 and 47: Construction 1 AT A GLANCE 1996-200
- Page 48 and 49: Figure 1 Fuel Use for Energy 2002 E
- Page 50 and 51: Figure 4 Trends in Construction and
- Page 52 and 53: Food & Beverage Manufacturing 1 AT
- Page 54 and 55: Figure 2 Air Emissions Reported to
- Page 56 and 57: associations, or government agencie
- Page 58 and 59: disposed or released to air or wate
- Page 60 and 61: Forest Products 1 AT A GLANCE 1996-
- Page 62 and 63: 2002 the manufacture of wood produc
- Page 64 and 65: emission controls to the pulping, p
- Page 66 and 67: Water discharges became a major foc
- Page 68 and 69: Iron & Steel 1 AT A GLANCE 1996-200
- Page 70 and 71: ton of steel shipped improved over
- Page 72 and 73: existing, high-toxicity weighting f
- Page 74 and 75: water that has been reused. Typical
- Page 76 and 77: Metal Casting 1 AT A GLANCE 1996-20
- Page 78 and 79: using a cupola furnace can dehumidi
- Page 80 and 81: Table 1 presents the top TRI-report
- Page 82 and 83: Waste Management Reported to TRI hi
- Page 84 and 85:
Oil & Gas AT A GLANCE 1996-2005 1,2
- Page 86 and 87:
equipment helps recover the gas. In
- Page 88 and 89:
The most widely used EOR technique
- Page 90 and 91:
Petroleum refining Latest Environme
- Page 92 and 93:
Figure 2 Al TRI HA s Air Emissions
- Page 94 and 95:
energy technologies, and improving
- Page 96 and 97:
Paint & Coatings 1 AT A GLANCE 1996
- Page 98 and 99:
Figure 1 Air Emissions Reported to
- Page 100 and 101:
Owned Treatment Works, but may also
- Page 102 and 103:
Ports 1 AT A GLANCE 2005: 360 publi
- Page 104 and 105:
Increasing Use of Solar Power The P
- Page 106 and 107:
developing retrofit and replacement
- Page 108 and 109:
“invasive” if they are capable
- Page 110 and 111:
shipbuilding & ship repair 1 AT A G
- Page 112 and 113:
of marine coatings. CAPs and GHGs a
- Page 114 and 115:
Table 1 Top TRI Air Emissions 2005
- Page 116 and 117:
Shipyards’ stormwater runoff is t
- Page 118 and 119:
data Sources, Methodologies, and CO
- Page 120 and 121:
Facilities described above must rep
- Page 122 and 123:
Data Processing RSEI calculates tox
- Page 124 and 125:
• Section 6.2: Transfers to other
- Page 126 and 127:
Cement Manufacturing 1. Facilities:
- Page 128 and 129:
12. Charles Heizenroth, EPA, person
- Page 130 and 131:
Forest Products 1. Facilities: Cens
- Page 132 and 133:
40. Includes direct discharges to w
- Page 134 and 135:
Public Data Release (PDR) (includes
- Page 136:
Advancing Port Sustainability, Janu