

2008 Sector Performance Report - US Environmental Protection ...
2008 Sector Performance Report - US Environmental Protection ...
2008 Sector Performance Report - US Environmental Protection ...

You also want an ePaper? Increase the reach of your titles
YUMPU automatically turns print PDFs into web optimized ePapers that Google loves.
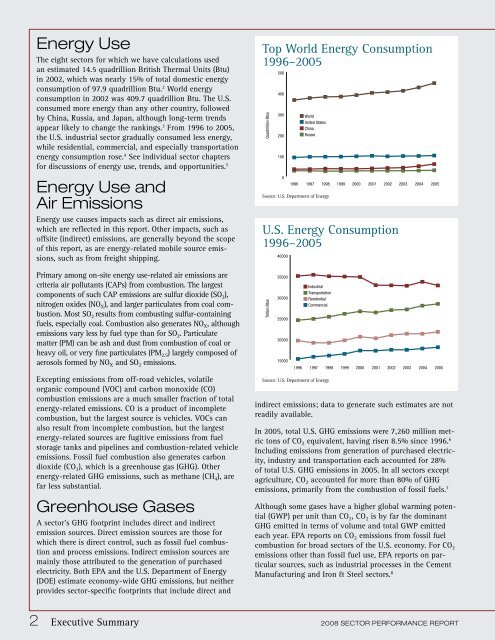
Energy Use<br />
The eight sectors for which we have calculations used<br />
an estimated 14.5 quadrillion British Thermal Units (Btu)<br />
in 2002, which was nearly 15% of total domestic energy<br />
consumption of 97.9 quadrillion Btu. 2 World energy<br />
consumption in 2002 was 409.7 quadrillion Btu. The U.S.<br />
consumed more energy than any other country, followed<br />
by China, Russia, and Japan, although long-term trends<br />
appear likely to change the rankings. 3 From 1996 to 2005,<br />
the U.S. industrial sector gradually consumed less energy,<br />
while residential, commercial, and especially transportation<br />
energy consumption rose. 4 See individual sector chapters<br />
for discussions of energy use, trends, and opportunities. 5<br />
Energy Use and<br />
Air Emissions<br />
Energy use causes impacts such as direct air emissions,<br />
which are reflected in this report. Other impacts, such as<br />
offsite (indirect) emissions, are generally beyond the scope<br />
of this report, as are energy-related mobile source emissions,<br />
such as from freight shipping.<br />
Primary among on-site energy use-related air emissions are<br />
criteria air pollutants (CAPs) from combustion. The largest<br />
components of such CAP emissions are sulfur dioxide (SO 2 ),<br />
nitrogen oxides (NO X ), and larger particulates from coal combustion.<br />
Most SO 2 results from combusting sulfur-containing<br />
fuels, especially coal. Combustion also generates NO X , although<br />
emissions vary less by fuel type than for SO 2 . Particulate<br />
matter (PM) can be ash and dust from combustion of coal or<br />
heavy oil, or very fine particulates (PM 2.5 ) largely composed of<br />
aerosols formed by NO X and SO 2 emissions.<br />
Excepting emissions from off-road vehicles, volatile<br />
organic compound (VOC) and carbon monoxide (CO)<br />
combustion emissions are a much smaller fraction of total<br />
energy-related emissions. CO is a product of incomplete<br />
combustion, but the largest source is vehicles. VOCs can<br />
also result from incomplete combustion, but the largest<br />
energy-related sources are fugitive emissions from fuel<br />
storage tanks and pipelines and combustion-related vehicle<br />
emissions. Fossil fuel combustion also generates carbon<br />
dioxide (CO 2 ), which is a greenhouse gas (GHG). Other<br />
energy-related GHG emissions, such as methane (CH 4 ), are<br />
far less substantial.<br />
Greenhouse Gases<br />
A sector’s GHG footprint includes direct and indirect<br />
emission sources. Direct emission sources are those for<br />
which there is direct control, such as fossil fuel combustion<br />
and process emissions. Indirect emission sources are<br />
mainly those attributed to the generation of purchased<br />
electricity. Both EPA and the U.S. Department of Energy<br />
(DOE) estimate economy-wide GHG emissions, but neither<br />
provides sector-specific footprints that include direct and<br />
Top World Energy Consumption<br />
1996–2005<br />
Quadrrillion Btus<br />
U.S. Energy Consumption<br />
1996–2005<br />
Trillion Btus<br />
500<br />
400<br />
300<br />
200<br />
100<br />
0<br />
40000<br />
35000<br />
30000<br />
25000<br />
20000<br />
15000<br />
World<br />
United States<br />
China<br />
Russia<br />
1996 1997 1998 1999 2000 2001 2002 2003 2004 2005<br />
Source: U.S. Department of Energy<br />
Industrial<br />
Transportation<br />
Residential<br />
Commercial<br />
1996 1997 1998 1999 2000 2001 2002 2003 2004 2005<br />
Source: U.S. Department of Energy<br />
indirect emissions; data to generate such estimates are not<br />
readily available.<br />
In 2005, total U.S. GHG emissions were 7,260 million metric<br />
tons of CO 2 equivalent, having risen 8.5% since 1996. 6<br />
Including emissions from generation of purchased electricity,<br />
industry and transportation each accounted for 28%<br />
of total U.S. GHG emissions in 2005. In all sectors except<br />
agriculture, CO 2 accounted for more than 80% of GHG<br />
emissions, primarily from the combustion of fossil fuels. 7<br />
Although some gases have a higher global warming potential<br />
(GWP) per unit than CO 2 , CO 2 is by far the dominant<br />
GHG emitted in terms of volume and total GWP emitted<br />
each year. EPA reports on CO 2 emissions from fossil fuel<br />
combustion for broad sectors of the U.S. economy. For CO 2<br />
emissions other than fossil fuel use, EPA reports on particular<br />
sources, such as industrial processes in the Cement<br />
Manufacturing and Iron & Steel sectors. 8<br />
2 Executive Summary <strong>2008</strong> SECTOR PERFORMANCE REPORT


