

2008 Sector Performance Report - US Environmental Protection ...
2008 Sector Performance Report - US Environmental Protection ...
2008 Sector Performance Report - US Environmental Protection ...

You also want an ePaper? Increase the reach of your titles
YUMPU automatically turns print PDFs into web optimized ePapers that Google loves.
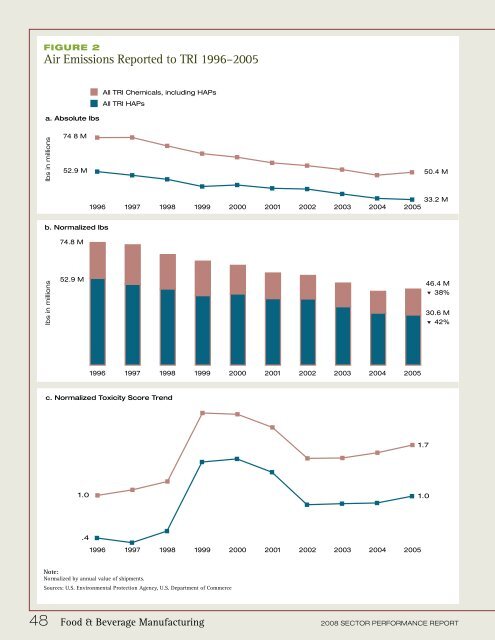
Figure 2<br />
Air Emissions <strong>Report</strong>ed to TRI 1996–2005<br />
All TRI Chemicals, including HAPs<br />
All TRI HAPs Chem<br />
a. Absolute lbs<br />
a<br />
lbs in mi in lmillions mill lbs in m o in l millions ions s<br />
74<br />
sol<br />
8<br />
te<br />
M<br />
52.9 M 50.4 M<br />
33.2 M<br />
1996 1997 1998 1999 2000 2001 2002 2003 2004 2005<br />
b. Normalized 1996 lbs<br />
74.8 M<br />
52.9 M<br />
46.4 M<br />
.4 38% M<br />
30.6 M<br />
42% 6 M<br />
1996 1997 1998 1999 2000 2001 2002 2003 2004 2005<br />
c. Normalized Toxicity Score Trend<br />
1.7<br />
1.0<br />
1.0<br />
.4<br />
1996 1997 1998 1999 2000 2001 2002 2003 2004 2005<br />
Note:<br />
Normalized by annual value of shipments.<br />
Sources: U.S. <strong>Environmental</strong> <strong>Protection</strong> Agency, U.S. Department of Commerce<br />
48 Food & Beverage Manufacturing <strong>2008</strong> SECTOR PERFORMANCE REPORT


