

2008 Sector Performance Report - US Environmental Protection ...
2008 Sector Performance Report - US Environmental Protection ...
2008 Sector Performance Report - US Environmental Protection ...

Create successful ePaper yourself
Turn your PDF publications into a flip-book with our unique Google optimized e-Paper software.
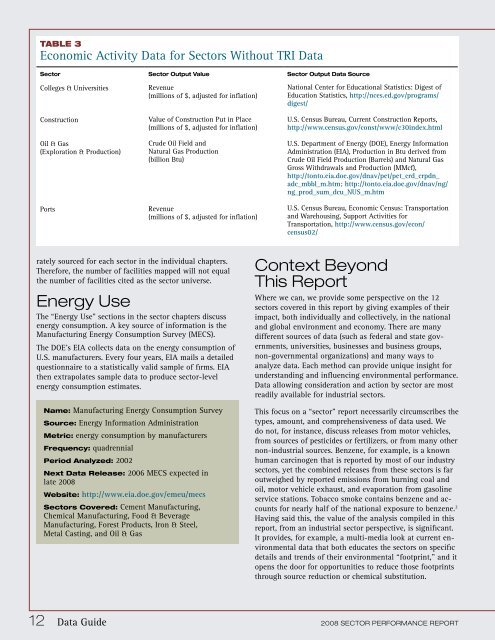
TABLE 3<br />
Economic Activity Data for <strong>Sector</strong>s Without TRI Data<br />
<strong>Sector</strong> <strong>Sector</strong> Output Value <strong>Sector</strong> Output Data Source<br />
Colleges & Universities<br />
Construction<br />
Oil & Gas<br />
(Exploration & Production)<br />
Ports<br />
Revenue<br />
(millions of $, adjusted for inflation)<br />
Value of Construction Put in Place<br />
(millions of $, adjusted for inflation)<br />
Crude Oil Field and<br />
Natural Gas Production<br />
(billion Btu)<br />
Revenue<br />
(millions of $, adjusted for inflation)<br />
National Center for Educational Statistics: Digest of<br />
Education Statistics, http://nces.ed.gov/programs/<br />
digest/<br />
U.S. Census Bureau, Current Construction <strong>Report</strong>s,<br />
http://www.census.gov/const/www/c30index.html<br />
U.S. Department of Energy (DOE), Energy Information<br />
Administration (EIA), Production in Btu derived from<br />
Crude Oil Field Production (Barrels) and Natural Gas<br />
Gross Withdrawals and Production (MMcf),<br />
http://tonto.eia.doe.gov/dnav/pet/pet_crd_crpdn_<br />
adc_mbbl_m.htm; http://tonto.eia.doe.gov/dnav/ng/<br />
ng_prod_sum_dcu_N<strong>US</strong>_m.htm<br />
U.S. Census Bureau, Economic Census: Transportation<br />
and Warehousing, Support Activities for<br />
Transportation, http://www.census.gov/econ/<br />
census02/<br />
rately sourced for each sector in the individual chapters.<br />
Therefore, the number of facilities mapped will not equal<br />
the number of facilities cited as the sector universe.<br />
Energy Use<br />
The “Energy Use” sections in the sector chapters discuss<br />
energy consumption. A key source of information is the<br />
Manufacturing Energy Consumption Survey (MECS).<br />
The DOE’s EIA collects data on the energy consumption of<br />
U.S. manufacturers. Every four years, EIA mails a detailed<br />
questionnaire to a statistically valid sample of firms. EIA<br />
then extrapolates sample data to produce sector-level<br />
energy consumption estimates.<br />
Name: Manufacturing Energy Consumption Survey<br />
Source: Energy Information Administration<br />
Metric: energy consumption by manufacturers<br />
Frequency: quadrennial<br />
Period Analyzed: 2002<br />
Next Data Release: 2006 MECS expected in<br />
late <strong>2008</strong><br />
Website: http://www.eia.doe.gov/emeu/mecs<br />
<strong>Sector</strong>s Covered: Cement Manufacturing,<br />
Chemical Manufacturing, Food & Beverage<br />
Manufacturing, Forest Products, Iron & Steel,<br />
Metal Casting, and Oil & Gas<br />
Context Beyond<br />
This <strong>Report</strong><br />
Where we can, we provide some perspective on the 12<br />
sectors covered in this report by giving examples of their<br />
impact, both individually and collectively, in the national<br />
and global environment and economy. There are many<br />
different sources of data (such as federal and state governments,<br />
universities, businesses and business groups,<br />
non-governmental organizations) and many ways to<br />
analyze data. Each method can provide unique insight for<br />
understanding and influencing environmental performance.<br />
Data allowing consideration and action by sector are most<br />
readily available for industrial sectors.<br />
This focus on a “sector” report necessarily circumscribes the<br />
types, amount, and comprehensiveness of data used. We<br />
do not, for instance, discuss releases from motor vehicles,<br />
from sources of pesticides or fertilizers, or from many other<br />
non-industrial sources. Benzene, for example, is a known<br />
human carcinogen that is reported by most of our industry<br />
sectors, yet the combined releases from these sectors is far<br />
outweighed by reported emissions from burning coal and<br />
oil, motor vehicle exhaust, and evaporation from gasoline<br />
service stations. Tobacco smoke contains benzene and accounts<br />
for nearly half of the national exposure to benzene. 2<br />
Having said this, the value of the analysis compiled in this<br />
report, from an industrial sector perspective, is significant.<br />
It provides, for example, a multi-media look at current environmental<br />
data that both educates the sectors on specific<br />
details and trends of their environmental “footprint,” and it<br />
opens the door for opportunities to reduce those footprints<br />
through source reduction or chemical substitution.<br />
12 Data Guide <strong>2008</strong> SECTOR PERFORMANCE REPORT


