Proceedings - C-SRNWP Project
Proceedings - C-SRNWP Project
Proceedings - C-SRNWP Project

You also want an ePaper? Increase the reach of your titles
YUMPU automatically turns print PDFs into web optimized ePapers that Google loves.
3D-FGAT<br />
Tests with the 3D-FGAT method were started at the Hungarian Meteorological Service.<br />
Originally the 3D-FGAT coded in ARPEGE/ALADIN adds the analysis increment to the<br />
background at the beginning of the assimilation window, as it is a simplification of 4DVAR.<br />
For better comparison with 3DVAR this feature was changed by adding the increment to the<br />
background at the middle of the assimilation window. For the comparison of 3D-FGAT with<br />
3DVAR several assimilation experiments were run using as many observations as possible.<br />
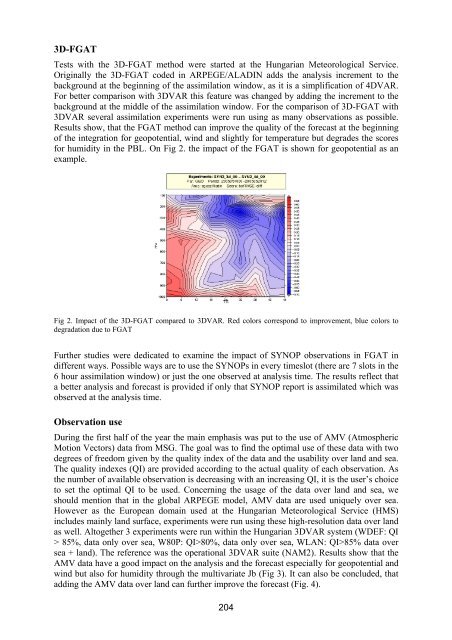
Results show, that the FGAT method can improve the quality of the forecast at the beginning<br />
of the integration for geopotential, wind and slightly for temperature but degrades the scores<br />
for humidity in the PBL. On Fig 2. the impact of the FGAT is shown for geopotential as an<br />
example.<br />
Fig 2. Impact of the 3D-FGAT compared to 3DVAR. Red colors correspond to improvement, blue colors to<br />
degradation due to FGAT<br />
Further studies were dedicated to examine the impact of SYNOP observations in FGAT in<br />
different ways. Possible ways are to use the SYNOPs in every timeslot (there are 7 slots in the<br />
6 hour assimilation window) or just the one observed at analysis time. The results reflect that<br />
a better analysis and forecast is provided if only that SYNOP report is assimilated which was<br />
observed at the analysis time.<br />
Observation use<br />
During the first half of the year the main emphasis was put to the use of AMV (Atmospheric<br />
Motion Vectors) data from MSG. The goal was to find the optimal use of these data with two<br />
degrees of freedom given by the quality index of the data and the usability over land and sea.<br />
The quality indexes (QI) are provided according to the actual quality of each observation. As<br />
the number of available observation is decreasing with an increasing QI, it is the user’s choice<br />
to set the optimal QI to be used. Concerning the usage of the data over land and sea, we<br />
should mention that in the global ARPEGE model, AMV data are used uniquely over sea.<br />
However as the European domain used at the Hungarian Meteorological Service (HMS)<br />
includes mainly land surface, experiments were run using these high-resolution data over land<br />
as well. Altogether 3 experiments were run within the Hungarian 3DVAR system (WDEF: QI<br />
> 85%, data only over sea, W80P: QI>80%, data only over sea, WLAN: QI>85% data over<br />
sea + land). The reference was the operational 3DVAR suite (NAM2). Results show that the<br />
AMV data have a good impact on the analysis and the forecast especially for geopotential and<br />
wind but also for humidity through the multivariate Jb (Fig 3). It can also be concluded, that<br />
adding the AMV data over land can further improve the forecast (Fig. 4).<br />
204