- Page 1:
NEWSLETTER of the 28 th EWGLAM and
- Page 4 and 5:
Newsletter of the 28th EWGLAM and 1
- Page 6 and 7:
6.2 P. Clark et al.: The Convective
- Page 8 and 9:
1.1 Foreword In 2006, MeteoSwiss ha
- Page 10 and 11:
Cornel Soci National Meteorological
- Page 12 and 13:
16:15 - 16:45 Filip Vana general Dy
- Page 14 and 15:
2 Consortia and ECMWF reports 12
- Page 16 and 17:
Research Progress at ECMWF 2005-200
- Page 18 and 19:
ocean data assimilation system for
- Page 20 and 21:
Physical Aspects 1) The introductio
- Page 22 and 23:
either with a 1-dimensional observa
- Page 24 and 25:
2.2 ALADIN 22
- Page 26 and 27:
Another important event happened, i
- Page 28 and 29:
• However inspection of T2m forec
- Page 31 and 32:
Figure 4: One case of intercomparis
- Page 33 and 34:
The COSMO Consortium in 2005-2006 T
- Page 35 and 36:
2. Model system overview The key fe
- Page 37 and 38:
Data Assimilation for LM Method: Nu
- Page 39 and 40:
2. LM performance known, critically
- Page 41 and 42:
expected to result in an improved r
- Page 43 and 44:
Schrodin, R. and H. Heise, 2002: Th
- Page 45 and 46:
HIRLAM-A activities in 2006 Jeanett
- Page 47 and 48:
addition, research on the construct
- Page 49 and 50:
HIRLAM Reference System development
- Page 51 and 52:
Fig. 2: Case study for 10 June 2006
- Page 53 and 54:
Unified Model Developments 2006 Met
- Page 55 and 56:
Figure 4: Noise in increments from
- Page 57 and 58:
Cycle Date Model change and impact
- Page 59 and 60:
1.5km On-demand model Figure 8: 1.5
- Page 61 and 62:
3.1 Belgium 59
- Page 63 and 64:
• A prognostic mass-flux scheme f
- Page 65 and 66:
Perspectives The integrated package
- Page 67 and 68:
3.2 Croatia 65
- Page 69 and 70:
New computer Core of the new comput
- Page 71 and 72:
3.3 Czech Republic 69
- Page 73 and 74:
¾¿ Ø Ó ÂÒÙÖÝ ¾¼¼ ËÛØ
- Page 75 and 76:
ÏÄÅ ÊÔÓÖØ ¾¼¼ ÖÓÑ Ø
- Page 77 and 78:
ÙÖ ¿ ËÙÖ ÔÖÑØÖ× ÖÓÑ
- Page 79 and 80:
LAM efforts at Estonian Meteorologi
- Page 81 and 82:
grid is 186x170 points in horizonta
- Page 83 and 84:
McDonald, A., and J. E. Haugen, 199
- Page 85 and 86:
Operational NWP Activities at the F
- Page 87 and 88:
Model Forecast model Limited area g
- Page 89 and 90:
3.7 France 87
- Page 91 and 92:
Fig.1. The ALADIN-France domain, wi
- Page 93 and 94:
Towards AROME, A first try of a Rap
- Page 95 and 96:
Status Report of the Deutscher Wett
- Page 97 and 98:
In August 2006 production with the
- Page 99 and 100:
3.9 Hungary 97
- Page 101 and 102:
• LBC coupling at every 3 hours O
- Page 103 and 104:
IFS as driving model for ALADIN. Th
- Page 105 and 106:
3.10 Ireland 103
- Page 107 and 108:
Filtering: Fourth order implicit ho
- Page 109 and 110:
The next chart shows wind arrows at
- Page 111 and 112:
Italian Meteorological Service Stat
- Page 113 and 114:
Fig.3 Integration domain for LM- EU
- Page 115 and 116:
3.12 Netherlands 113
- Page 117 and 118:
esults with fixed entrainment and d
- Page 119 and 120:
simulation. In order to allow a goo
- Page 121 and 122:
layer for three contrasting nights
- Page 123 and 124:
21 UTC). The severe thunderstorm fo
- Page 125 and 126:
Limited Area Modelling Activities a
- Page 127 and 128:
(a) Figure 2 ALADIN/Portugal geogra
- Page 129 and 130:
een locally implemented as an optim
- Page 131 and 132:
LAM ACTIVITIES IN ROMANIA Cornel SO
- Page 133 and 134:
Fig.3 HRM domain, 78 cumulated prec
- Page 135 and 136:
- Experiments : variation of the fr
- Page 137 and 138:
NWP activities at Slovak Hydrometeo
- Page 139 and 140:
Operational suite upgrades • 23/0
- Page 141 and 142:
3.16 Slovenia 139
- Page 143 and 144:
First experiments with new physical
- Page 145 and 146:
• resolution of meteorological fi
- Page 147 and 148:
NWP activities in INM Bartolomé Or
- Page 149 and 150:
1 System definition • Creation of
- Page 151 and 152:
MSLP June-August 2006 Geopotential
- Page 153 and 154:
NATIONAL STATUS REPORT on Operation
- Page 155 and 156:
Model input The observations used f
- Page 157 and 158:
Numerical Weather Prediction at Met
- Page 159 and 160:
The setup is based on a new numeric
- Page 161 and 162:
weight of importance in the voting
- Page 163 and 164:
4.1 F. Vana: Dynamics & Coupling, A
- Page 165 and 166:
Ô¸ ×ØÐ Ò ÒÓÒ¹ÐÒÖ «Ù
- Page 167 and 168: ÙÖØÖ ÒÚ×ØØÓÒ ÔÖÓÚ Ø
- Page 169 and 170: Ì ×Ô¬ ÓÒÐÙ×ÓÒ× ÓÖ Ø
- Page 171 and 172: ÁÐÞ Ø×Ø× Ó ÄÁƹÆÀ Ý
- Page 173 and 174: ¯ ÒÐÐÝ Ø Ò×ØÐØÝ Ó ØÛ
- Page 175 and 176: ÀÓÖÞÓÒØÐ Ñ× ×Þ Û× ¡
- Page 177 and 178: ÔÓØÒØÐ ÓÛ ×¸ Ù×Ø Ø
- Page 179 and 180: ÒÓÒ¹ÝÖÓ×ØØ ÝÖÓ×ØØ 1
- Page 181 and 182: 5 Scientific presentations on data
- Page 183 and 184: COSMO: Overview and Strategy on Dat
- Page 185 and 186: Meteorology in Hamburg (MPI-M). The
- Page 187 and 188: temperature forecasts, this had a s
- Page 189 and 190: 5.2 D. Leuenberger et al.: The Late
- Page 191 and 192: scaling factor α and of the latent
- Page 193 and 194: a) b) RAD 1 2 3 4 5 6 7 8 9 10 det
- Page 195 and 196: 5.3 C. Fischer and A. Horanyi: Alad
- Page 197 and 198: Figure 1: analysis increments of wi
- Page 199 and 200: 3) Averaged emissivities + dynamica
- Page 201 and 202: In parallel, a direct radar observa
- Page 203 and 204: ►Algorithms: • FGAT (with Hunga
- Page 205 and 206: Data assimilation activities in LAC
- Page 207 and 208: Fig.3 RMSE difference (WDEF-NAM2).
- Page 209 and 210: 6 Scientific presentations on physi
- Page 211 and 212: Physics improvements in the NAE mod
- Page 213 and 214: The top panel in figure 3 shows tha
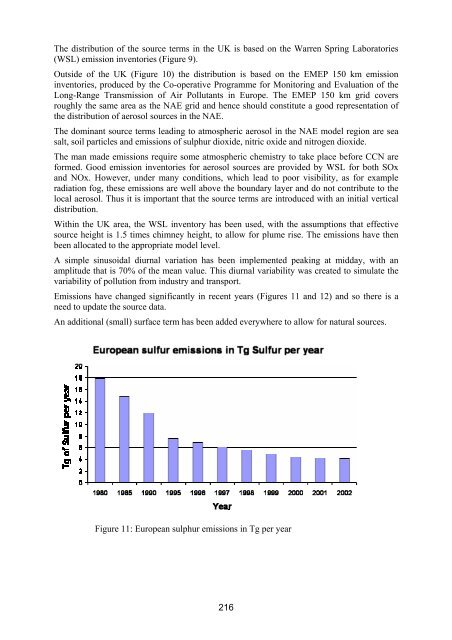
- Page 215 and 216: The Murk aerosol is based on the ur
- Page 217: Relaxation term Due to these proble
- Page 221 and 222: Buncefield oil depot fire Figure 15
- Page 223 and 224: 6.2 P. Clark et al.: The Convective
- Page 225 and 226: y the model (e.g. streaks of gradua
- Page 227 and 228: the Met Office Large Eddy Model (LE
- Page 229 and 230: Figure 4 Domains used in high resol
- Page 231 and 232: 1.0 95th percentile threshold Fract
- Page 233 and 234: Figure 10 Surface precipitation rat
- Page 235 and 236: HIRLAM Physics developments Sander
- Page 237 and 238: strong winds. This causes a too lar
- Page 239 and 240: epresenting the weather in the case
- Page 241 and 242: ËÒÓÛ¸ ÓÖ×Ø Ò Ð ×ÔØ×
- Page 243 and 244: £ ½ ×Ò ¼ Þ ×Ò ×Ò · ¼
- Page 245 and 246: ¿º½ ÊØÓÒ Ò Ø ÓÖ×Ø Ï
- Page 247 and 248: ÙÖ Ì¾Ñ ×¸ ÐØ ÒÛ ×ÙÖ
- Page 249 and 250: ×ÖÔØÓÒ Ó Ð ÑÓк ̺
- Page 251 and 252: ALARO-0 Physics developments at LAC
- Page 253 and 254: eflectance for sample of 3-layer in
- Page 255 and 256: 2.1 Pseudo prognostic turbulent kin
- Page 257 and 258: TKE and the integral buoyancy of th
- Page 259 and 260: 7 Scientific presentations on predi
- Page 261 and 262: LAMEPS Development of ALADIN-LACE Y
- Page 263 and 264: The more iterations performed, the
- Page 265 and 266: uncertainty in the model physics, t
- Page 267 and 268: In Budapest, dynamical downscaling
- Page 269 and 270:
7.2 J. García-Moya et al.: Recent
- Page 271 and 272:
Currently the size of the super ens
- Page 273 and 274:
Palmer, T.N., Alessandri, A., Ander
- Page 275 and 276:
Figure 4 Example of probability map
- Page 277 and 278:
More than 15 mm/6 hours Figure 6 Re
- Page 279 and 280:
7.3 C. Marsigli et al.: The COSMO S
- Page 281 and 282:
ÔÓ××Ð Ù×× Ó ÓÖ×Ø ÖÖ
- Page 283 and 284:
ÇËÅÇßËÊÈË × ½ßÑÑÖ
- Page 285 and 286:
¾℄ ÅÖ×и º¸ ÅÓÒØÒ¸
- Page 287 and 288:
Overview COSMO ensemble systems Pie
- Page 289 and 290:
COSMO-LEPS 16-MEMBER EPS An objecti
- Page 291 and 292:
The used models are LAMI (Italy), a
- Page 293 and 294:
28th EWGLAM Meeting 9-11 October 20
- Page 295 and 296:
9 SRNWP business meeting report 293
- Page 297 and 298:
Minutes of the Meeting Participatio
- Page 299 and 300:
Training and Education Activities i
- Page 301 and 302:
These reports were very divers, fro
- Page 303:
Contacts with the Academia In his d