Annual Report 2009 - Husqvarna Group
Annual Report 2009 - Husqvarna Group
Annual Report 2009 - Husqvarna Group

You also want an ePaper? Increase the reach of your titles
YUMPU automatically turns print PDFs into web optimized ePapers that Google loves.
32 <strong>Husqvarna</strong> <strong>Annual</strong> <strong>Report</strong> <strong>2009</strong> <strong>Report</strong> by the Board of Directors<br />
Net sales and operating income<br />
Net sales<br />
Net sales in <strong>2009</strong> increased by 5% to SEK 34,074 (32,342), but<br />
declined by 8% after adjustment for changes in exchange rates<br />
and acquisitions.<br />
The decline in sales refers mainly to Professional Products.<br />
Sales for Consumer Products increased in SEK, but decreased<br />
after adjustment for changes in exchange rates and acquisitions<br />
(see page 35).<br />
Operating income<br />
Operating income declined by 34% to SEK 1,560m (2,361), corresponding<br />
to a margin of 4.6% (7.3). Operating income<br />
includes restructuring costs of SEK 452m (316) (see below).<br />
Operating margin was 5.9% (8.3), excluding restructuring<br />
costs.<br />
Apart from costs for restructuring, the decline in operating<br />
income is due mainly to lower sales and production volumes,<br />
as well as a less favorable mix in terms of products and geographical<br />
markets. In terms of business areas, the decline<br />
refers mainly to Consumer Products outside North America,<br />
and to Construction products within Professional Products.<br />
Effects of changes in exchange-rates<br />
Changes in exchange rates, including both translation and<br />
transaction effects and net of hedging contracts, had a total<br />
positive effect on operating income of SEK 30m (184). Hedging<br />
contracts had an adverse effect of SEK -109m (-89).<br />
Costs for restructuring<br />
Total costs for restructuring in <strong>2009</strong> amounted to SEK 452m, of<br />
which SEK 53m refers to capacity adjustments and personnel<br />
cutbacks initiated in 2008, and SEK 399m to structural<br />
changes communicated in October <strong>2009</strong>. Of the SEK 399m,<br />
SEK 175m refers to non-cash items. For details on restructuring<br />
costs per quarter, see table below.<br />
These structural changes are aimed at eliminating overlapping<br />
and duplication in production and administration, and<br />
involve consolidation of production in Sweden and the US, and<br />
of the sales organization in Europe and Asia/Pacific.<br />
Measures are scheduled to be implemented during <strong>2009</strong>–<br />
2011, and will involve a net reduction of approximately 400 in<br />
the number of employees.<br />
<strong>Annual</strong> savings are estimated at approximately SEK 400m,<br />
and will be generated gradually from the second half of 2010,<br />
taking full effect as of the first quarter of 2012.<br />
Change in operating income<br />
SEKm<br />
Operating income 2008 2,361<br />
Acquisitions 15<br />
Price 500<br />
Volume and mix –1,360<br />
Cost of materials 150<br />
Restructuring costs –136<br />
Changes in exchange rates 30<br />
Operating income <strong>2009</strong> 1,560<br />
Financial net<br />
Net financial items amounted to SEK –466m (–594). The<br />
improvement is due mainly to lower interest rates, as well as<br />
lower net debt as a result of both the rights issue and the<br />
improvement in cash flow during the year. As of year-end the<br />
average interest rate for total borrowings was 3.2% (4.3).<br />
Income after financial items<br />
Income after financial items declined by 38% to SEK 1,094m<br />
(1,767), corresponding to a margin of 3.2% (5.5).<br />
Restructuring costs, SEKm 2008 <strong>2009</strong> Estimated<br />
annual<br />
Q3 Q4 Total Q1 Q2 Q3 Q4 Total savings<br />
Costs for restructuring 1 –59 –340 –399 400 3<br />
Costs for personnel cut backs 2 –15 –301 –316 –35 –18 –53 450 4<br />
1) As communicated in October <strong>2009</strong>.<br />
2) As communicated in September 2008.<br />
3) Expected to be generated gradually from the second half of 2010, with full effect as of the Q1 2012.<br />
4) Full effect as of Q3 <strong>2009</strong>.<br />
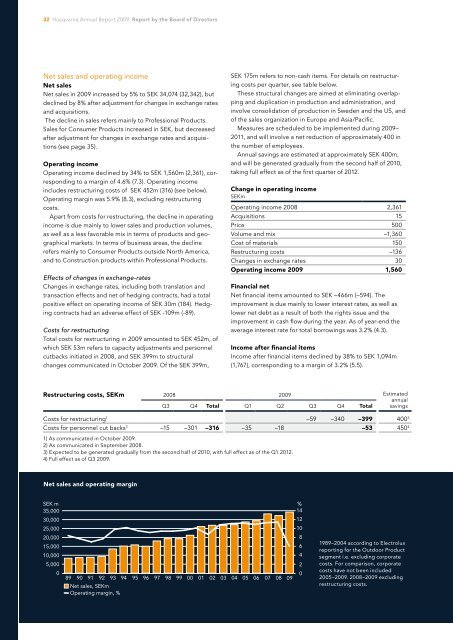
Net sales and operating margin<br />
SEK m %<br />
35,000<br />
14<br />
30,000<br />
25,000<br />
20,000<br />
15,000<br />
10,000<br />
5,000<br />
0<br />
89 90 91 92 93 94 95 96 97 98 99 00 01 02 03 04 05 06 07 08<br />
Net sales, SEKm<br />
Operating margin, %<br />
09<br />
12<br />
10<br />
8<br />
6<br />
4<br />
2<br />
0<br />
1989–2004 according to Electrolux<br />
reporting for the Outdoor Product<br />
segment i.e. excluding corporate<br />
costs. For comparison, corporate<br />
costs have not been included<br />
2005–<strong>2009</strong>. 2008–<strong>2009</strong> excluding<br />
restructuring costs.