Annual Report 2009 - Husqvarna Group
Annual Report 2009 - Husqvarna Group
Annual Report 2009 - Husqvarna Group

Create successful ePaper yourself
Turn your PDF publications into a flip-book with our unique Google optimized e-Paper software.
34 <strong>Husqvarna</strong> <strong>Annual</strong> <strong>Report</strong> <strong>2009</strong> <strong>Report</strong> by the Board of Directors<br />
Major R&D projects during the year referred mainly to the<br />
products mentioned above.<br />
During <strong>2009</strong> the <strong>Group</strong> has also capitalized SEK 60m (12)<br />
mainly referring to software.<br />
Financial position<br />
Operating working capital<br />
Operating working capital at year-end decreased to SEK 7,237m<br />
(9,460). Inventories declined to SEK 6,706m (8,556) and trade<br />
receivables to SEK 3,385m (4,184). Trade payables declined to<br />
SEK 2,854m (3,280).<br />
Change in operating working capital<br />
SEKm<br />
31 December 2008 9,460<br />
Changes in exchange rates –226<br />
Other changes –1,997<br />
31 December <strong>2009</strong> 7,237<br />
Equity<br />
<strong>Group</strong> equity as of 31 December <strong>2009</strong>, excluding minority<br />
interests, rose to SEK 12,082m (8,772), corresponding to<br />
SEK 22.0 (19.3) per share. The increase is mainly a result of the<br />
rights issue. Equity per share for 2008 has been adjusted to<br />
reflect the rights issue in <strong>2009</strong>.<br />
Net debt<br />
Net debt at year-end decreased to SEK 6,349m (13,552). Liquid<br />
funds were largely unchanged at SEK 2,745m (2 735), while<br />
interest-bearing debt decreased to SEK 9,094m (16,287). The<br />
reduction in net debt is mainly a result of the rights issue that<br />
was completed in April and the improvement in cash flow during<br />
the year.<br />
At year-end the <strong>Group</strong> had unutilized committed credit facilities<br />
of SEK 10,000m (6,500).<br />
For more information about the <strong>Group</strong>’s funding, see Note 2.<br />
The net debt/equity ratio improved to 0.52 (1.54) and the<br />
equity/assets ratio to 40.1% (25.7). The improvement in both<br />
ratios resulted mainly from the rights issue and a reduction of<br />
working capital.<br />
Net debt<br />
SEKm <strong>2009</strong> 2008<br />
Interest-bearing liabilities 9,094 16,287<br />
Liquid funds 2,745 2,735<br />
Net debt 6,349 13,552<br />
Net debt/equity ratio, times 0.52 1.54<br />
Equity/assets ratio, % 40.1 25.7<br />
Seasonality in sales and income<br />
The majority of <strong>Group</strong> sales are garden products, which show<br />
a pronounced seasonality in terms of sales and income. The<br />
first half of the year normally accounts for about two thirds of<br />
<strong>Group</strong> sales, with the second quarter usually being the strongest.<br />
This refers particularly to Consumer Products, but also to<br />
Lawn and Garden within Professional Products. Irrigation<br />
products have a larger share of sales and operating income in<br />
the first half of the year, and particularly in the second quarter,<br />
than the rest of the <strong>Group</strong>’s consumer products.<br />
Forestry products show stronger demand and somewhat<br />
higher sales during the second half of the year, while equipment<br />
for the construction industry normally shows a more<br />
even distribution of sales throughout the year.<br />
Demand for the <strong>Group</strong>’s products is also dependent on<br />
weather conditions. Dry weather tends to reduce demand for<br />
such products as lawn mowers and tractors, but to increase<br />
demand for irrigation products. Demand for chainsaws normally<br />
increases after storms.<br />
Performance by business area<br />
Until year-end <strong>2009</strong>, operations in <strong>Husqvarna</strong> comprised two<br />
business areas – Consumer Products and Professional Products.<br />
Consumer Products includes two geographical areas, i.e.<br />
North America and Rest of the world. Professional Products<br />
includes three product areas, i.e. Forestry, Lawn and Garden,<br />
and Construction.<br />
As of 1 January 2010, the <strong>Group</strong> has a new organization,<br />
which will involve a change of the <strong>Group</strong>’s reporting structure<br />
as of the first quarter of 2010 (see page 96).<br />
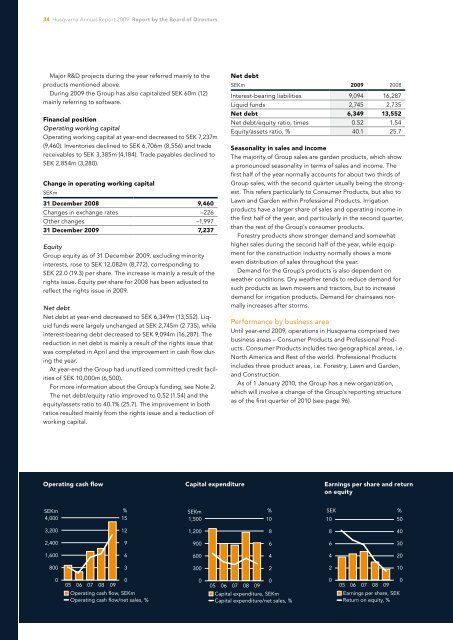
Operating cash flow<br />
Capital expenditure<br />
Earnings per share and return<br />
on equity<br />
SEKm<br />
4,000<br />
%<br />
15<br />
SEKm<br />
1,500<br />
%<br />
10<br />
SEK<br />
10<br />
%<br />
50<br />
3,200<br />
12<br />
1,200<br />
8<br />
8<br />
40<br />
2,400<br />
9<br />
900<br />
6<br />
6<br />
30<br />
1,600<br />
6<br />
600<br />
4<br />
4<br />
20<br />
800<br />
3<br />
300<br />
2<br />
2<br />
10<br />
0<br />
05 06 07 08 09<br />
Operating cash flow, SEKm<br />
Operating cash flow/net sales, %<br />
0<br />
0<br />
05 06 07 08 09<br />
Capital expenditure, SEKm<br />
Capital expenditure/net sales, %<br />
0<br />
0<br />
05 06 07 08 09<br />
Earnings per share, SEK<br />
Return on equity, %<br />
0