Annual Report 2009 - Husqvarna Group
Annual Report 2009 - Husqvarna Group
Annual Report 2009 - Husqvarna Group

You also want an ePaper? Increase the reach of your titles
YUMPU automatically turns print PDFs into web optimized ePapers that Google loves.
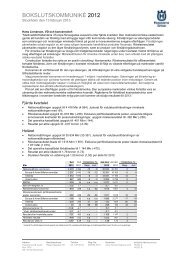
94 <strong>Husqvarna</strong> <strong>Annual</strong> <strong>Report</strong> <strong>2009</strong><br />
Quarterly data<br />
Income, SEKm Q1 Q2 Q3 Q4 Full year<br />
Net sales <strong>2009</strong> 11,152 11,481 6,709 4,732 34,074<br />
2008 10,043 10,343 6,830 5,126 32,342<br />
2007 9,214 12,048 6,826 5,196 33,284<br />
EBITDA <strong>2009</strong> 1,138 1,452 492 –22 3,060<br />
2008 1,488 1,595 593 –152 3,524<br />
2007 1,211 2,049 836 549 4,645<br />
EBITDA margin, % <strong>2009</strong> 10.2 12.6 7.3 –0.5 9.0<br />
2008 14.8 15.4 8.7 –3.0 10.9<br />
2007 13.1 17.0 12.2 10.6 14.0<br />
Operating income <strong>2009</strong> 786 1,116 173 –515 1,560<br />
2008 1,202 1,321 310 –472 2,361<br />
2007 984 1,758 553 269 3,564<br />
Operating income excl. restructuring costs <strong>2009</strong> 821 1,134 232 –175 2,012<br />
2008 1,202 1,321 325 –171 2,677<br />
2007 984 1,758 553 269 3,564<br />
Operating margin, % <strong>2009</strong> 7.0 9.7 2.6 –10.9 4.6<br />
2008 12.0 12.8 4.5 –9.2 7.3<br />
2007 10.7 14.6 8.1 5.2 10.7<br />
Operating margin excl. restructuring costs, % <strong>2009</strong> 7.4 9.9 3.5 –3.7 5.9<br />
2008 12.0 12.8 4.8 –3.3 8.3<br />
2007 10.7 14.6 8.1 5.2 10.7<br />
Income after financial items <strong>2009</strong> 590 944 108 –548 1,094<br />
2008 1,060 1,141 178 –612 1,767<br />
2007 876 1,528 391 94 2,889<br />
Margin, % <strong>2009</strong> 5.3 8.2 1.6 –11.6 3.2<br />
2008 10.6 11.0 2.6 –11.9 5.5<br />
2007 9.5 12.7 5.7 1.8 8.7<br />
Income for the period <strong>2009</strong> 464 761 130 –452 903<br />
2008 753 810 143 –418 1,288<br />
2007 613 1,070 273 80 2,036<br />
Earnings per share, SEK 1 <strong>2009</strong> 0.98 1.35 0.23 –0.79 1.64<br />
2008 1.65 1.77 0.32 –0.93 2.81<br />
2007 1.34 2.34 0.59 0.19 4.46<br />
Financial position, SEKm Q1 Q2 Q3 Q4 Full year<br />
Inventories <strong>2009</strong> 8,975 6,979 5,823 6,706 6,706<br />
2008 7,723 6,642 6,361 8,556 8,556<br />
2007 6,578 6,157 5,965 7,758 7,758<br />
Equity <strong>2009</strong> 12,579 13,003 12,416 12,126 12,126<br />
2008 7,903 7,939 8,614 8,815 8,815<br />
2007 6,986 7,334 7,284 7,389 7,389<br />
Interest-bearing liabilities <strong>2009</strong> 12,895 12,929 10,276 9,094 9,094<br />
2008 16,245 14,901 13,168 16,287 16,287<br />
2007 15,645 15,239 13,262 13,318 13,318<br />
Net debt <strong>2009</strong> 10,312 9,137 6,918 6,349 6,349<br />
2008 14,734 13,387 12,014 13,552 13,552<br />
2007 14,535 13,377 11,540 12,012 12,012<br />
Working capital <strong>2009</strong> 6,700 6,524 4,794 4,163 4,163<br />
2008 9,784 8,101 6,381 6,462 6,462<br />
2007 8,664 7,159 5,592 6,146 6,146<br />
1) Number of shares have been adjusted for rights issue made in <strong>2009</strong>.