- Page 1:
Engineering behavior of small-scale
- Page 6 and 7:
viLIST OF FIGURESFigure 1: Concept
- Page 8 and 9:
viiiFigure 62: Stress-settlement te
- Page 10 and 11:
xLIST OF TABLESTable 1: Stiffness m
- Page 12 and 13:
xiiLIST OF EQUATIONSEquation 1: Ult
- Page 14 and 15:
xivSymbol Description Unitsγ dry l
- Page 16 and 17:
1CHAPTER 1: INTRODUCTIONIndustry Pr
- Page 22 and 23:
7MAKECAVITYPLACESTONE ATBOTTOM OFCA
- Page 24 and 25:
9Normal Stress, kPaShear Stress. kP
- Page 26 and 27:
11pier element for a maximum of 25
- Page 28 and 29:
13savings provided by the system (A
- Page 30 and 31:
15The bearing capacity accredited t
- Page 32 and 33:
17Equation 12: Load resistance prov
- Page 34 and 35: 19Soil conditions at the site were
- Page 36 and 37: Settlement (mm)Settlement (mm)10202
- Page 38 and 39: 23Site soil conditions were describ
- Page 40 and 41: 25Article#ReferenceTable 2: Case st
- Page 42 and 43: 27Article#7ReferenceHughes andWithe
- Page 44 and 45: 29replaced with method of freezing
- Page 46 and 47: UNREINFORCED COLUMNNO COLUMNREINFOR
- Page 48 and 49: 33The load carrying capacity was fo
- Page 50 and 51: 35Case 5 - Bachus and Barksdale, 19
- Page 52 and 53: 37full depth of the consolidated la
- Page 54 and 55: 39CHAPTER 3: RESEARCH METHODOLOGYCr
- Page 56 and 57: 41itself was designed to be support
- Page 58 and 59: 43While it is obvious that the chan
- Page 60 and 61: 45To perform all the required testi
- Page 62 and 63: 47In the areas where access was lim
- Page 64 and 65: 49CBR from DCPThe California Bearin
- Page 66 and 67: 305 mm610 mm305 mm610 mm305 mm610 m
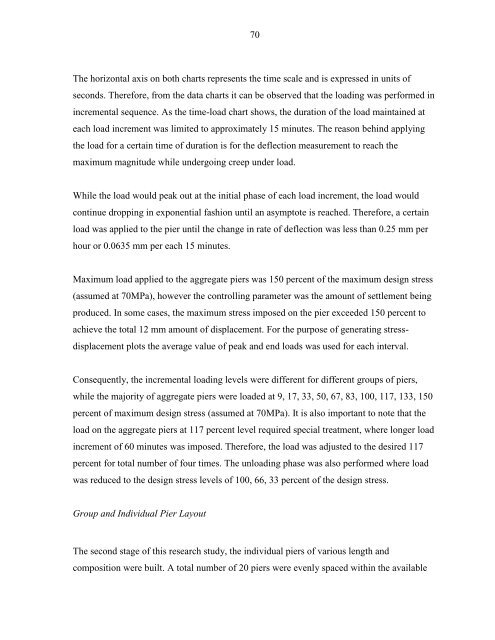
- Page 68 and 69: 53The process of using the Shelby t
- Page 70 and 71: 15881556144815591597154915271586158
- Page 72 and 73: 57Table 14: Top and bottom UC loess
- Page 74 and 75: 59Data Collection and SensorsHaving
- Page 76 and 77: 61Micro Epsilon displacement transd
- Page 78 and 79: 63plate down the cavity through man
- Page 80 and 81: 65Beveled Tamper HeadsThe other asp
- Page 82 and 83: 67All, aggregate, cementitious and
- Page 86 and 87: 71space in the test bed (See Figure
- Page 88 and 89: 73(a)(b)(c)Figure 42: Test bed grou
- Page 90 and 91: 75CHAPTER 4: MATERIALSThe materials
- Page 92 and 93: 7710080LL = 31PI = 7Pass. #200 = 98
- Page 94 and 95: 79the second stage of testing. Mois
- Page 96 and 97: 81Knowing the gradation characteris
- Page 98 and 99: 83More importantly, the performed d
- Page 100 and 101: 85Figure 49: Cement type I compound
- Page 102 and 103: 87As the expansive and contractive
- Page 104 and 105: 89Figure 55: 19 mm polypropylene fi
- Page 106 and 107: 91CHAPTER 5: TEST RESULTS AND ANALY
- Page 108 and 109: 93Applied stress at top of pier (kP
- Page 110 and 111: 95Figure 60: Stress-settlement test
- Page 112 and 113: 97Figure 62: Stress-settlement test
- Page 114 and 115: 99Figure 64: Stress-settlement test
- Page 116 and 117: 101Figure 66: Stress-settlement tes
- Page 118 and 119: 103Figure 68: Stress-settlement tes
- Page 120 and 121: 105Settlement (mm)024681012Applied
- Page 122 and 123: 107to the maximum displacement of 1
- Page 124 and 125: 109The failure mechanism of other p
- Page 126 and 127: 1113000Measured Bearing Capacity (k
- Page 128 and 129: 113Applied stress at bottom of the
- Page 130 and 131: 115Figure 76: Stress-settlement tes
- Page 132 and 133: 117Figure 78: Stress-settlement tes
- Page 134 and 135:
119Settlement (mm)0246810Applied st
- Page 136 and 137:
121The group efficiency results wer
- Page 138 and 139:
123Pier typeAggregate PierUnit Cell
- Page 140 and 141:
125Figure 82: Stress-settlement tes
- Page 142 and 143:
127Figure 85: Stress-settlement tes
- Page 144 and 145:
129Figure 87: Stress-settlement tes
- Page 146 and 147:
131Applied stress at bottom of the
- Page 148 and 149:
133Table 33: Group efficiency compa
- Page 150 and 151:
135Having a limited amount of exper
- Page 152 and 153:
137Stiffness, kPa/mm600500400300200
- Page 154 and 155:
139In case with the piers consistin
- Page 156 and 157:
141Table 36: Stiffness ratio calcul
- Page 158 and 159:
143Some of the loess composition pi
- Page 160 and 161:
145Pier typeAggregatePierSingle Pie
- Page 162 and 163:
147Another observation was made, wh
- Page 164 and 165:
149As previously outlined, the stif
- Page 166 and 167:
151pier group efficiency values wer
- Page 168 and 169:
Stiffness Ratio1538Figure 91: Stiff
- Page 170 and 171:
155CHAPTER 7: SUMMARY AND CONCLUSIO
- Page 172 and 173:
157MaterialsLoess-CementVery intrig
- Page 174 and 175:
159Groups of PiersGroup of Aggregat
- Page 176 and 177:
161CHAPTER 8: FUTURE RESEARCHThe fu
- Page 178 and 179:
163Black, J.A., Sivakumar, V., Madh
- Page 180 and 181:
165Hanlong, L., An, D., and Yang, S
- Page 182 and 183:
167Randrup T.B., and Lichter, J.M.
- Page 184 and 185:
169Yeh, Y.K., and Mo, Y.L. (2005).
- Page 186 and 187:
171Group EfficiencyAggregate Pier G
- Page 188 and 189:
173Aggregate Pier305mm Wedge HeadDC
- Page 190 and 191:
175Loess + Fibers305mm Single PierD
- Page 192 and 193:
177Sand305mm Single PierDCPI, mm/bl
- Page 194 and 195:
179Aggregate Pier305mm Group of 4DC
- Page 196 and 197:
181C(I) + C(K)305mm Group of 4DCPI,
- Page 198 and 199:
183Aggregate Pier305mm Wedge HeadCB
- Page 200 and 201:
185Loess + Fibers305mm Single PierC
- Page 202 and 203:
187Sand305mm Single PierCBR, %0 2 4
- Page 204 and 205:
189Aggregate Pier305mm Group of 4CB
- Page 206 and 207:
191C(I) + C(K)305mm Group of 4CBR,