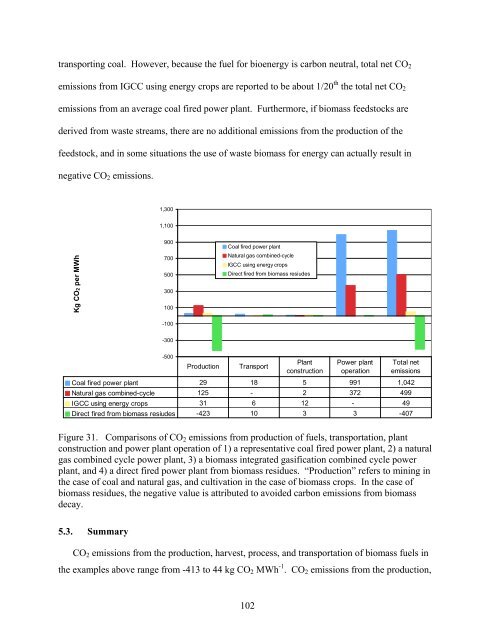
Table 36. <strong>Biomass</strong> yield, carbon content of biomass, fuel consumption, and carbon content offuel of four hardwood removal projects in north Florida reported by Condon and Putz (2007).Carbon in dieselDiesel consumed consumedProjectHarvestedchipsCarbon in harvestedchips Harvest Transport Harvest Transport(Dry Mg) (Mg) (liters) (Mg)A 2,875 1,351 27,005 16,133 19.7 11.8B 1,683 791 15,986 13,306 11.7 9.7C 1,047 492 11,031 7,400 8.1 5.4D 983 462 8,517 6,825 6.2 5Table 37. CO 2 analysis of yields and inputs reported by Condon and Putz (2007) shown in Table36.CarbonCO 2Project Mg) (Mg) (Mg) a reductions (Mg) b chips (MWh) c CO 2 /MWh)Harvestedchips (DryinharvestedchipsTotal CO 2emitted inproduction CO 2 emissionsPotentialgenerationfrom harvestedEmissionsfromproduction (kgA 2,875 1,351 116 4,954 3,070 38B 1,683 791 78 2,900 1,797 44C 1,047 492 50 1,804 1,118 44D 983 462 41 1,694 1,050 39a Calculated as carbon in diesel consumed in harvest plus carbon in diesel consumed in transporttimes 3.67 to convert carbon to CO 2 .b Estimated as carbon in harvested chips times 3.67 to convert carbon to CO 2 .c Calculated as dry Mg chips*0.901 tons/Mg*16 million Btu/dry ton* 1 MWh/13.5 million Btu.Studies by Mann and Spath (1997; 2002) and Spath et al. (1999) at the NationalRenewable Energy Laboratory have evaluated CO 2 emissions and energy efficiencies ofproducing, handling, processing and converting energy resources, including fossil fuels andbiomass. Mann and Spath presented comparisons of a representative coal fired power plant, anatural gas combined cycle power plant, a biomass integrated gasification combined cycle powerplant, and a direct fired power plant from biomass residues (Figure 31). Emissions fromcultivation, harvesting, processing, and transportation of biomass from energy crops are reportedto be 37 kg CO 2 MWh -1 , close to the 46 kg CO 2 MWh -1 reported for mining, processing, and101
transporting coal. However, because the fuel for bioenergy is carbon neutral, total net CO 2emissions from IGCC using energy crops are reported to be about 1/20 th the total net CO 2emissions from an average coal fired power plant. Furthermore, if biomass feedstocks arederived from waste streams, there are no additional emissions from the production of thefeedstock, and in some situations the use of waste biomass for energy can actually result innegative CO 2 emissions.1,3001,100Kg CO2 per MWh900700500300100Coal fired power plantNatural gas combined-cycleIGCC using energy cropsDirect fired from biomass resiudes-100-300-500ProductionTransportPlantconstructionPower plantoperationTotal netemissionsCoal fired power plant 29 18 5 991 1,042Natural gas combined-cycle 125 - 2 372 499IGCC using energy crops 31 6 12 - 49Direct fired from biomass resiudes -423 10 3 3 -407Figure 31. Comparisons of CO 2 emissions from production of fuels, transportation, plantconstruction and power plant operation of 1) a representative coal fired power plant, 2) a naturalgas combined cycle power plant, 3) a biomass integrated gasification combined cycle powerplant, and 4) a direct fired power plant from biomass residues. “Production” refers to mining inthe case of coal and natural gas, and cultivation in the case of biomass crops. In the case ofbiomass residues, the negative value is attributed to avoided carbon emissions from biomassdecay.5.3. SummaryCO 2 emissions from the production, harvest, process, and transportation of biomass fuels inthe examples above range from -413 to 44 kg CO 2 MWh -1 . CO 2 emissions from the production,102
- Page 3 and 4:
ACKNOWLEDGEMENTSThe authors acknowl
- Page 5 and 6:
4.2. Scenario A: Delivered to remot
- Page 7:
Figure 22. Projected softwood and h
- Page 10 and 11:
LIST OF ACRONYMS AND ABBREVIATIONSB
- Page 12 and 13:
1. INTRODUCTION1.1. Project Backgro
- Page 14 and 15:
Task-3: Transportation. Transportat
- Page 16 and 17:
2. TASK 1: WOODSHED DELINEATION AND
- Page 18 and 19:
calculations for urban wood waste a
- Page 20 and 21:
the current pulpwood harvests are a
- Page 22 and 23:
2,0001,800Acres (thousands)1,6001,4
- Page 24 and 25:
ton -1 ($17.38 green ton -1 ) for t
- Page 26 and 27:
$ per million BTU, delivered$4.00$3
- Page 28 and 29:
10.65 TBtu/year required to meet de
- Page 30 and 31:
haul time category in each county,
- Page 32 and 33:
Figure 9. TAL Hopkins two-hour one-
- Page 34 and 35:
Figure 11. GRU, JEA, and TAL woodsh
- Page 36 and 37:
Dry tonsrecoverableTBtu/yearRecover
- Page 38 and 39:
Dry tonsrecoverableTBtu/yearrecover
- Page 40 and 41:
Table 6. Results for scenario #3,
- Page 42 and 43:
Table 7. Results for scenario #4,
- Page 44 and 45:
Table 9. Results for scenario #6,
- Page 46 and 47:
6.005.004.00$/MMBtu3.002.001.001: W
- Page 48 and 49:
Resource/haul time categoryDry tons
- Page 50 and 51:
Resource/haul time categoryDry tons
- Page 52 and 53:
Table 12. Results for scenario #3,
- Page 54 and 55: Table 13. Results for scenario #4,
- Page 56 and 57: Table 15. Results for scenario #6,
- Page 58 and 59: 6.005.004.00$/MMBtu3.002.001.001: W
- Page 60 and 61: Resource/haul time categoryDry tons
- Page 62 and 63: Resource/haul time categoryDry tons
- Page 64 and 65: Table 18. Results for scenario #3,
- Page 66: Table 19. Results for scenario #4,
- Page 69 and 70: Resource/haul time categoryDry tons
- Page 71 and 72: 2.4.4. General resultsIt is difficu
- Page 73 and 74: Table 22. Yield, acreage required,
- Page 75 and 76: Table 25. Capital construction outp
- Page 77 and 78: 3. TASK 2: SUSTAINABILITY IMPACTS F
- Page 79 and 80: under this scenario are expected to
- Page 81 and 82: acres in 1995 to 8.5 MM acres in 20
- Page 83 and 84: 3.3. RESULTS3.3.1. GRUTable 27. Res
- Page 85 and 86: 5.004.504.003.50$/MMBtu3.002.502.00
- Page 87 and 88: Table 30. Results for the conservat
- Page 89 and 90: 3.3.3. TAL Hopkins facilityTable 31
- Page 91 and 92: 5.004.504.003.50$/MMBtu3.002.502.00
- Page 93 and 94: For GRU most of these do not apply;
- Page 95 and 96: Table 33. Concentration yard costs.
- Page 97 and 98: location of the rail siding and the
- Page 99 and 100: discussed, to get an idea of the pr
- Page 101 and 102: 5. TASK 4: CO 2 EMISSIONS FROM HARV
- Page 103: in fuel chips and the carbon in fue
- Page 107 and 108: 6. COMBINED RESOURCE AVAILABILITYPa
- Page 109 and 110: Resource/haul time categoryTBtu/yea
- Page 111 and 112: Table 39. Combined resources (resou
- Page 113 and 114: Resource/haul time categoryTBtu/yea
- Page 115 and 116: Resource/haul time categoryTBtu/yea
- Page 117 and 118: Resource/haul time categoryTBtu/yea
- Page 119 and 120: OverstockedNatural Stands,0.16, 1%
- Page 121 and 122: logging residues from 90% to 60% to
- Page 123 and 124: ecommend that GRU, in coordination
- Page 125: 9. REFERENCESBlack and Veach (2004)