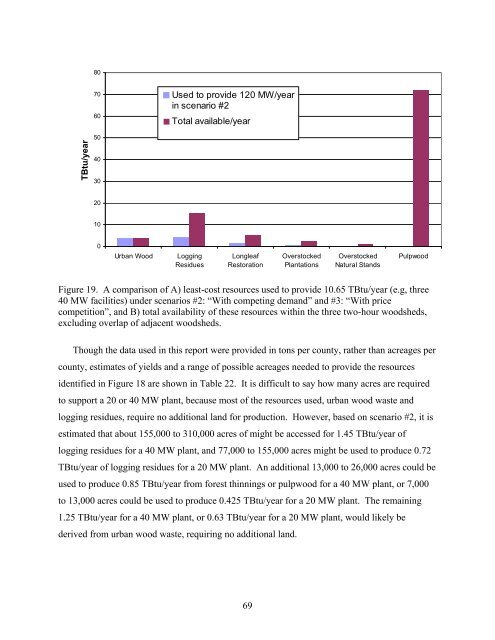
807060Used to provide 120 MW/yearin scenario #2Total available/year50TBtu/year403020100Urban WoodLoggingResiduesLongleafRestorationOverstockedPlantationsOverstockedNatural StandsPulpwoodFigure 19. A comparison of A) least-cost resources used to provide 10.65 TBtu/year (e.g, three40 MW facilities) under scenarios #2: “With competing demand” and #3: “With pricecompetition”, and B) total availability of these resources within the three two-hour woodsheds,excluding overlap of adjacent woodsheds.Though the data used in this report were provided in tons per county, rather than acreages percounty, estimates of yields and a range of possible acreages needed to provide the resourcesidentified in Figure 18 are shown in Table 22. It is difficult to say how many acres are requiredto support a 20 or 40 MW plant, because most of the resources used, urban wood waste andlogging residues, require no additional land for production. However, based on scenario #2, it isestimated that about 155,000 to 310,000 acres of might be accessed for 1.45 TBtu/year oflogging residues for a 40 MW plant, and 77,000 to 155,000 acres might be used to produce 0.72TBtu/year of logging residues for a 20 MW plant. An additional 13,000 to 26,000 acres could beused to produce 0.85 TBtu/year from forest thinnings or pulpwood for a 40 MW plant, or 7,000to 13,000 acres could be used to produce 0.425 TBtu/year for a 20 MW plant. The remaining1.25 TBtu/year for a 40 MW plant, or 0.63 TBtu/year for a 20 MW plant, would likely bederived from urban wood waste, requiring no additional land.69
Table 22. Yield, acreage required, available acreage, heat content, % water, and % ash forbiomass resources.<strong>Biomass</strong><strong>Resource</strong>Yield peryearAcreagerequiredfor three40 MWplantsAcreageavailableHeatcontent(Btu/dry lb)Percentwater% ash (dryweight basis)UrbanwoodLoggingresiduesThinningsandpulpwood0.122greentons/person0.3-0.6 drytons/acre2.0-4.0 drytons/acreN/A N/A 8,200 40% 5%460,000-930,000 11,387,469 b 8,200 37% 5%acres a39,000-79,000 11,387,469 b 8,200 47% 2%acres ca Estimated acres required to produce 4.34 TBtu/year of logging residues identified in Figure 18.b Reported privately owned timberland in Florida, USDA FS Mapmaker, September 2007.c Estimated acreage required to produce 2.55 TBtu/year of thinning and pulpwood identified inFigure 18.2.5. Economic impacts (by Drs. Alan Hodges and Mohammad Rahmani)Developing bioenergy facilities will impact local economies through the construction offacilities, purchasing locally available biomass, and operation and maintenance expenditures.The construction impacts of the project would be a one-time event that is assumed to occurwithin a year, while the impacts of plant operations continue each year. Fuel costs werecalculated from the supply analysis results for GRU, JEA, and TAL from scenario #2: “Withcompeting demand”, and economic impacts were estimated using a software program calledIMPLAN together with regional databases for Alachua, Duval, and Leon Counties. Resultsinclude outputs (the total revenue generated by an industry, including sales, plus changes inbusiness inventories), jobs generated by sector, and value-added impacts (total personal andbusiness net income). Capital construction impacts for 20 MW and 40 MW facilities are shownin Table 23. Annual (first year) impacts for 20 MW and 40 MW facilities are show in Table 24.Capital construction output impacts by industry for 20 MW and 40 MW plants are shown in70
- Page 3 and 4:
ACKNOWLEDGEMENTSThe authors acknowl
- Page 5 and 6:
4.2. Scenario A: Delivered to remot
- Page 7:
Figure 22. Projected softwood and h
- Page 10 and 11:
LIST OF ACRONYMS AND ABBREVIATIONSB
- Page 12 and 13:
1. INTRODUCTION1.1. Project Backgro
- Page 14 and 15:
Task-3: Transportation. Transportat
- Page 16 and 17:
2. TASK 1: WOODSHED DELINEATION AND
- Page 18 and 19:
calculations for urban wood waste a
- Page 20 and 21:
the current pulpwood harvests are a
- Page 22 and 23: 2,0001,800Acres (thousands)1,6001,4
- Page 24 and 25: ton -1 ($17.38 green ton -1 ) for t
- Page 26 and 27: $ per million BTU, delivered$4.00$3
- Page 28 and 29: 10.65 TBtu/year required to meet de
- Page 30 and 31: haul time category in each county,
- Page 32 and 33: Figure 9. TAL Hopkins two-hour one-
- Page 34 and 35: Figure 11. GRU, JEA, and TAL woodsh
- Page 36 and 37: Dry tonsrecoverableTBtu/yearRecover
- Page 38 and 39: Dry tonsrecoverableTBtu/yearrecover
- Page 40 and 41: Table 6. Results for scenario #3,
- Page 42 and 43: Table 7. Results for scenario #4,
- Page 44 and 45: Table 9. Results for scenario #6,
- Page 46 and 47: 6.005.004.00$/MMBtu3.002.001.001: W
- Page 48 and 49: Resource/haul time categoryDry tons
- Page 50 and 51: Resource/haul time categoryDry tons
- Page 52 and 53: Table 12. Results for scenario #3,
- Page 54 and 55: Table 13. Results for scenario #4,
- Page 56 and 57: Table 15. Results for scenario #6,
- Page 58 and 59: 6.005.004.00$/MMBtu3.002.001.001: W
- Page 60 and 61: Resource/haul time categoryDry tons
- Page 62 and 63: Resource/haul time categoryDry tons
- Page 64 and 65: Table 18. Results for scenario #3,
- Page 66: Table 19. Results for scenario #4,
- Page 69 and 70: Resource/haul time categoryDry tons
- Page 71: 2.4.4. General resultsIt is difficu
- Page 75 and 76: Table 25. Capital construction outp
- Page 77 and 78: 3. TASK 2: SUSTAINABILITY IMPACTS F
- Page 79 and 80: under this scenario are expected to
- Page 81 and 82: acres in 1995 to 8.5 MM acres in 20
- Page 83 and 84: 3.3. RESULTS3.3.1. GRUTable 27. Res
- Page 85 and 86: 5.004.504.003.50$/MMBtu3.002.502.00
- Page 87 and 88: Table 30. Results for the conservat
- Page 89 and 90: 3.3.3. TAL Hopkins facilityTable 31
- Page 91 and 92: 5.004.504.003.50$/MMBtu3.002.502.00
- Page 93 and 94: For GRU most of these do not apply;
- Page 95 and 96: Table 33. Concentration yard costs.
- Page 97 and 98: location of the rail siding and the
- Page 99 and 100: discussed, to get an idea of the pr
- Page 101 and 102: 5. TASK 4: CO 2 EMISSIONS FROM HARV
- Page 103 and 104: in fuel chips and the carbon in fue
- Page 105 and 106: transporting coal. However, because
- Page 107 and 108: 6. COMBINED RESOURCE AVAILABILITYPa
- Page 109 and 110: Resource/haul time categoryTBtu/yea
- Page 111 and 112: Table 39. Combined resources (resou
- Page 113 and 114: Resource/haul time categoryTBtu/yea
- Page 115 and 116: Resource/haul time categoryTBtu/yea
- Page 117 and 118: Resource/haul time categoryTBtu/yea
- Page 119 and 120: OverstockedNatural Stands,0.16, 1%
- Page 121 and 122: logging residues from 90% to 60% to
- Page 123 and 124:
ecommend that GRU, in coordination
- Page 125:
9. REFERENCESBlack and Veach (2004)