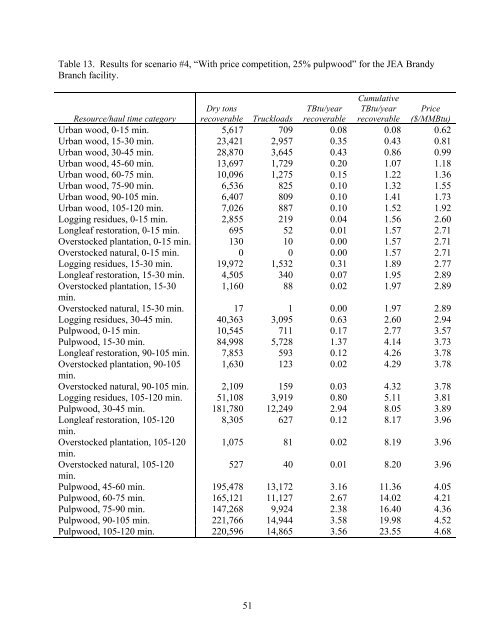
Table 13. Results for scenario #4, “With price competition, 25% pulpwood” for the JEA BrandyBranch facility.<strong>Resource</strong>/haul time categoryDry tonsrecoverable TruckloadsTBtu/yearrecoverableCumulativeTBtu/yearrecoverablePrice($/MMBtu)Urban wood, 0-15 min. 5,617 709 0.08 0.08 0.62Urban wood, 15-30 min. 23,421 2,957 0.35 0.43 0.81Urban wood, 30-45 min. 28,870 3,645 0.43 0.86 0.99Urban wood, 45-60 min. 13,697 1,729 0.20 1.07 1.18Urban wood, 60-75 min. 10,096 1,275 0.15 1.22 1.36Urban wood, 75-90 min. 6,536 825 0.10 1.32 1.55Urban wood, 90-105 min. 6,407 809 0.10 1.41 1.73Urban wood, 105-120 min. 7,026 887 0.10 1.52 1.92Logging residues, 0-15 min. 2,855 219 0.04 1.56 2.60Longleaf restoration, 0-15 min. 695 52 0.01 1.57 2.71Overstocked plantation, 0-15 min. 130 10 0.00 1.57 2.71Overstocked natural, 0-15 min. 0 0 0.00 1.57 2.71Logging residues, 15-30 min. 19,972 1,532 0.31 1.89 2.77Longleaf restoration, 15-30 min. 4,505 340 0.07 1.95 2.89Overstocked plantation, 15-30 1,160 88 0.02 1.97 2.89min.Overstocked natural, 15-30 min. 17 1 0.00 1.97 2.89Logging residues, 30-45 min. 40,363 3,095 0.63 2.60 2.94Pulpwood, 0-15 min. 10,545 711 0.17 2.77 3.57Pulpwood, 15-30 min. 84,998 5,728 1.37 4.14 3.73Longleaf restoration, 90-105 min. 7,853 593 0.12 4.26 3.78Overstocked plantation, 90-105 1,630 123 0.02 4.29 3.78min.Overstocked natural, 90-105 min. 2,109 159 0.03 4.32 3.78Logging residues, 105-120 min. 51,108 3,919 0.80 5.11 3.81Pulpwood, 30-45 min. 181,780 12,249 2.94 8.05 3.89Longleaf restoration, 105-120 8,305 627 0.12 8.17 3.96min.Overstocked plantation, 105-120 1,075 81 0.02 8.19 3.96min.Overstocked natural, 105-120527 40 0.01 8.20 3.96min.Pulpwood, 45-60 min. 195,478 13,172 3.16 11.36 4.05Pulpwood, 60-75 min. 165,121 11,127 2.67 14.02 4.21Pulpwood, 75-90 min. 147,268 9,924 2.38 16.40 4.36Pulpwood, 90-105 min. 221,766 14,944 3.58 19.98 4.52Pulpwood, 105-120 min. 220,596 14,865 3.56 23.55 4.6851
Table 14. Results for scenario #5, “One-hour haul radius with price competition” for the JEABrandy Branch facility.Cumulative<strong>Resource</strong>/haul time categoryDry tonsrecoverable TruckloadsTBtu/yearrecoverableTBtu/yearrecoverablePrice($/MMBtu)Urban wood, 0-15 min. 5,617 709 0.08 0.08 0.62Urban wood, 15-30 min. 23,421 2,957 0.35 0.43 0.81Urban wood, 30-45 min. 28,870 3,645 0.43 0.86 0.99Urban wood, 45-60 min. 13,697 1,729 0.20 1.07 1.18Logging residues, 0-15 min. 2,855 219 0.04 1.11 2.60Longleaf restoration, 0-15 min. 695 52 0.01 1.12 2.71Overstocked natural, 0-15 min. 130 10 0.00 1.13 2.71Overstocked plantation, 0-15 min. 0 0 0.00 1.13 2.71Logging residues, 15-30 min. 19,972 1,532 0.31 1.44 2.77Longleaf restoration, 15-30 min. 4,505 340 0.07 1.50 2.89Overstocked natural, 15-30 min. 1,160 88 0.02 1.52 2.89Overstocked plantation, 15-30 min. 17 1 0.00 1.52 2.89Logging residues, 30-45 min. 40,363 3,095 0.63 2.15 2.94Longleaf restoration, 30-45 min. 8,277 625 0.12 2.27 3.07Overstocked natural, 30-45 min. 1,944 147 0.03 2.30 3.07Overstocked plantation, 30-45 min. 176 13 0.00 2.31 3.07Logging residues, 45-60 min. 42,788 3,281 0.67 2.97 3.12Longleaf restoration, 45-60 min. 7,780 587 0.12 3.09 3.25Overstocked natural, 45-60 min. 4,213 318 0.06 3.15 3.25Overstocked plantation, 45-60 min. 982 74 0.01 3.17 3.25Pulpwood, 0-15 min. 10,545 711 0.17 3.34 3.36Pulpwood, 15-30 min. 84,998 5,728 1.37 4.71 3.52Pulpwood, 30-45 min. 181,780 12,249 2.94 7.65 3.68Pulpwood, 45-60 min. 195,478 13,172 3.16 10.81 3.8452
- Page 3 and 4: ACKNOWLEDGEMENTSThe authors acknowl
- Page 5 and 6: 4.2. Scenario A: Delivered to remot
- Page 7: Figure 22. Projected softwood and h
- Page 10 and 11: LIST OF ACRONYMS AND ABBREVIATIONSB
- Page 12 and 13: 1. INTRODUCTION1.1. Project Backgro
- Page 14 and 15: Task-3: Transportation. Transportat
- Page 16 and 17: 2. TASK 1: WOODSHED DELINEATION AND
- Page 18 and 19: calculations for urban wood waste a
- Page 20 and 21: the current pulpwood harvests are a
- Page 22 and 23: 2,0001,800Acres (thousands)1,6001,4
- Page 24 and 25: ton -1 ($17.38 green ton -1 ) for t
- Page 26 and 27: $ per million BTU, delivered$4.00$3
- Page 28 and 29: 10.65 TBtu/year required to meet de
- Page 30 and 31: haul time category in each county,
- Page 32 and 33: Figure 9. TAL Hopkins two-hour one-
- Page 34 and 35: Figure 11. GRU, JEA, and TAL woodsh
- Page 36 and 37: Dry tonsrecoverableTBtu/yearRecover
- Page 38 and 39: Dry tonsrecoverableTBtu/yearrecover
- Page 40 and 41: Table 6. Results for scenario #3,
- Page 42 and 43: Table 7. Results for scenario #4,
- Page 44 and 45: Table 9. Results for scenario #6,
- Page 46 and 47: 6.005.004.00$/MMBtu3.002.001.001: W
- Page 48 and 49: Resource/haul time categoryDry tons
- Page 50 and 51: Resource/haul time categoryDry tons
- Page 52 and 53: Table 12. Results for scenario #3,
- Page 56 and 57: Table 15. Results for scenario #6,
- Page 58 and 59: 6.005.004.00$/MMBtu3.002.001.001: W
- Page 60 and 61: Resource/haul time categoryDry tons
- Page 62 and 63: Resource/haul time categoryDry tons
- Page 64 and 65: Table 18. Results for scenario #3,
- Page 66: Table 19. Results for scenario #4,
- Page 69 and 70: Resource/haul time categoryDry tons
- Page 71 and 72: 2.4.4. General resultsIt is difficu
- Page 73 and 74: Table 22. Yield, acreage required,
- Page 75 and 76: Table 25. Capital construction outp
- Page 77 and 78: 3. TASK 2: SUSTAINABILITY IMPACTS F
- Page 79 and 80: under this scenario are expected to
- Page 81 and 82: acres in 1995 to 8.5 MM acres in 20
- Page 83 and 84: 3.3. RESULTS3.3.1. GRUTable 27. Res
- Page 85 and 86: 5.004.504.003.50$/MMBtu3.002.502.00
- Page 87 and 88: Table 30. Results for the conservat
- Page 89 and 90: 3.3.3. TAL Hopkins facilityTable 31
- Page 91 and 92: 5.004.504.003.50$/MMBtu3.002.502.00
- Page 93 and 94: For GRU most of these do not apply;
- Page 95 and 96: Table 33. Concentration yard costs.
- Page 97 and 98: location of the rail siding and the
- Page 99 and 100: discussed, to get an idea of the pr
- Page 101 and 102: 5. TASK 4: CO 2 EMISSIONS FROM HARV
- Page 103 and 104: in fuel chips and the carbon in fue
- Page 105 and 106:
transporting coal. However, because
- Page 107 and 108:
6. COMBINED RESOURCE AVAILABILITYPa
- Page 109 and 110:
Resource/haul time categoryTBtu/yea
- Page 111 and 112:
Table 39. Combined resources (resou
- Page 113 and 114:
Resource/haul time categoryTBtu/yea
- Page 115 and 116:
Resource/haul time categoryTBtu/yea
- Page 117 and 118:
Resource/haul time categoryTBtu/yea
- Page 119 and 120:
OverstockedNatural Stands,0.16, 1%
- Page 121 and 122:
logging residues from 90% to 60% to
- Page 123 and 124:
ecommend that GRU, in coordination
- Page 125:
9. REFERENCESBlack and Veach (2004)