Table 34. Yard cost per dry ton handled.Dry tonsper year $/dry ton $/MMBTU50,000 $9.89 $0.62100,000 $4.94 $0.31150,000 $3.30 $0.21200,000 $2.47 $0.15Very few concentration yards that transfer from truck to truck are in existence today. Thetotal volume they handle is dependent upon the surrounding biomass supply, and if local suppliesdwindle or the needs of the mill change, they become cost-prohibitive. By assuming differentlevels of volume actually received and handled, some estimate of the cost per dry ton can beestimated. Table 34 illustrates the impact of volume on the cost per dry ton of operating aconcentration yard. The table shows that if a concentration yard can be optimized to handle amaximum volume (in this example 200,000 dry tons or 400,000 green tons per year), then thecost per dry ton is $2.47 per dry ton. However, if actual volume handled is much less, then theper-ton cost could be $9.89 per dry ton. This cost is approximately equal to $.62 per MMBtu. Inreality, if volume is significantly below capacity some savings may be achieved by reducing payhours and fuel consumption, but the overall implications of volume dictating the per-ton cost ofoperating a concentration yard are still significant.4.3. Scenario B: <strong>Biomass</strong> delivered to remote site by truck, processed at site, anddelivered to Deerhaven by rail.The discussion of economic impact of remote sites under Scenario a) applies generallywhether the material is shipped out by truck or rail. In normal industry shipment out by rail ismore common, and this may allow collection of wood from farther distances and decrease trucktraffic.Rail transport is often evaluated in the development of biomass projects, especially forheavily urbanized locations. For GRU, rail access is available, so it must at least be considered.Rail involves an extra handling step in the delivery of all biomass. For almost all parts ofthe country rail cars cannot be directly loaded from the field (one exception is dedicated shortlinerailroads owned or controlled by the biomass user). If the biomass is derived from forestthinnings or logging residues, the material will have to be placed in a truck to remove it from theharvesting operation in the woods. This means that to use rail, the material will have to bedelivered to a rail siding by truck, unloaded, and then re-loaded into a rail car. Depending on the93
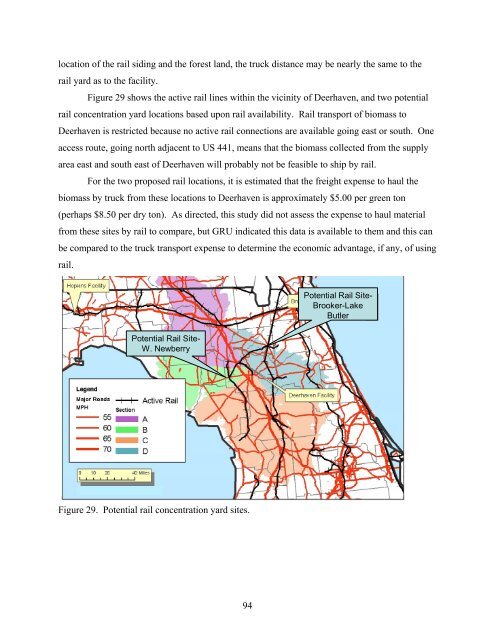
location of the rail siding and the forest land, the truck distance may be nearly the same to therail yard as to the facility.Figure 29 shows the active rail lines within the vicinity of Deerhaven, and two potentialrail concentration yard locations based upon rail availability. Rail transport of biomass toDeerhaven is restricted because no active rail connections are available going east or south. Oneaccess route, going north adjacent to US 441, means that the biomass collected from the supplyarea east and south east of Deerhaven will probably not be feasible to ship by rail.For the two proposed rail locations, it is estimated that the freight expense to haul thebiomass by truck from these locations to Deerhaven is approximately $5.00 per green ton(perhaps $8.50 per dry ton). As directed, this study did not assess the expense to haul materialfrom these sites by rail to compare, but GRU indicated this data is available to them and this canbe compared to the truck transport expense to determine the economic advantage, if any, of usingrail.Potential Rail Site-Brooker-LakeButlerPotential Rail Site-W. NewberryFigure 29. Potential rail concentration yard sites.94
- Page 3 and 4:
ACKNOWLEDGEMENTSThe authors acknowl
- Page 5 and 6:
4.2. Scenario A: Delivered to remot
- Page 7:
Figure 22. Projected softwood and h
- Page 10 and 11:
LIST OF ACRONYMS AND ABBREVIATIONSB
- Page 12 and 13:
1. INTRODUCTION1.1. Project Backgro
- Page 14 and 15:
Task-3: Transportation. Transportat
- Page 16 and 17:
2. TASK 1: WOODSHED DELINEATION AND
- Page 18 and 19:
calculations for urban wood waste a
- Page 20 and 21:
the current pulpwood harvests are a
- Page 22 and 23:
2,0001,800Acres (thousands)1,6001,4
- Page 24 and 25:
ton -1 ($17.38 green ton -1 ) for t
- Page 26 and 27:
$ per million BTU, delivered$4.00$3
- Page 28 and 29:
10.65 TBtu/year required to meet de
- Page 30 and 31:
haul time category in each county,
- Page 32 and 33:
Figure 9. TAL Hopkins two-hour one-
- Page 34 and 35:
Figure 11. GRU, JEA, and TAL woodsh
- Page 36 and 37:
Dry tonsrecoverableTBtu/yearRecover
- Page 38 and 39:
Dry tonsrecoverableTBtu/yearrecover
- Page 40 and 41:
Table 6. Results for scenario #3,
- Page 42 and 43:
Table 7. Results for scenario #4,
- Page 44 and 45:
Table 9. Results for scenario #6,
- Page 46 and 47: 6.005.004.00$/MMBtu3.002.001.001: W
- Page 48 and 49: Resource/haul time categoryDry tons
- Page 50 and 51: Resource/haul time categoryDry tons
- Page 52 and 53: Table 12. Results for scenario #3,
- Page 54 and 55: Table 13. Results for scenario #4,
- Page 56 and 57: Table 15. Results for scenario #6,
- Page 58 and 59: 6.005.004.00$/MMBtu3.002.001.001: W
- Page 60 and 61: Resource/haul time categoryDry tons
- Page 62 and 63: Resource/haul time categoryDry tons
- Page 64 and 65: Table 18. Results for scenario #3,
- Page 66: Table 19. Results for scenario #4,
- Page 69 and 70: Resource/haul time categoryDry tons
- Page 71 and 72: 2.4.4. General resultsIt is difficu
- Page 73 and 74: Table 22. Yield, acreage required,
- Page 75 and 76: Table 25. Capital construction outp
- Page 77 and 78: 3. TASK 2: SUSTAINABILITY IMPACTS F
- Page 79 and 80: under this scenario are expected to
- Page 81 and 82: acres in 1995 to 8.5 MM acres in 20
- Page 83 and 84: 3.3. RESULTS3.3.1. GRUTable 27. Res
- Page 85 and 86: 5.004.504.003.50$/MMBtu3.002.502.00
- Page 87 and 88: Table 30. Results for the conservat
- Page 89 and 90: 3.3.3. TAL Hopkins facilityTable 31
- Page 91 and 92: 5.004.504.003.50$/MMBtu3.002.502.00
- Page 93 and 94: For GRU most of these do not apply;
- Page 95: Table 33. Concentration yard costs.
- Page 99 and 100: discussed, to get an idea of the pr
- Page 101 and 102: 5. TASK 4: CO 2 EMISSIONS FROM HARV
- Page 103 and 104: in fuel chips and the carbon in fue
- Page 105 and 106: transporting coal. However, because
- Page 107 and 108: 6. COMBINED RESOURCE AVAILABILITYPa
- Page 109 and 110: Resource/haul time categoryTBtu/yea
- Page 111 and 112: Table 39. Combined resources (resou
- Page 113 and 114: Resource/haul time categoryTBtu/yea
- Page 115 and 116: Resource/haul time categoryTBtu/yea
- Page 117 and 118: Resource/haul time categoryTBtu/yea
- Page 119 and 120: OverstockedNatural Stands,0.16, 1%
- Page 121 and 122: logging residues from 90% to 60% to
- Page 123 and 124: ecommend that GRU, in coordination
- Page 125: 9. REFERENCESBlack and Veach (2004)