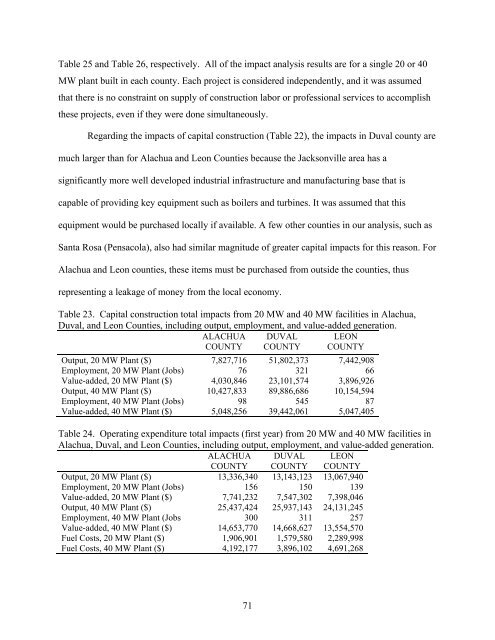
Table 25 and Table 26, respectively. All of the impact analysis results are for a single 20 or 40MW plant built in each county. Each project is considered independently, and it was assumedthat there is no constraint on supply of construction labor or professional services to accomplishthese projects, even if they were done simultaneously.Regarding the impacts of capital construction (Table 22), the impacts in Duval county aremuch larger than for Alachua and Leon Counties because the Jacksonville area has asignificantly more well developed industrial infrastructure and manufacturing base that iscapable of providing key equipment such as boilers and turbines. It was assumed that thisequipment would be purchased locally if available. A few other counties in our analysis, such asSanta Rosa (Pensacola), also had similar magnitude of greater capital impacts for this reason. ForAlachua and Leon counties, these items must be purchased from outside the counties, thusrepresenting a leakage of money from the local economy.Table 23. Capital construction total impacts from 20 MW and 40 MW facilities in Alachua,Duval, and Leon Counties, including output, employment, and value-added generation.ALACHUACOUNTYDUVALCOUNTYLEONCOUNTYOutput, 20 MW Plant ($) 7,827,716 51,802,373 7,442,908Employment, 20 MW Plant (Jobs) 76 321 66Value-added, 20 MW Plant ($) 4,030,846 23,101,574 3,896,926Output, 40 MW Plant ($) 10,427,833 89,886,686 10,154,594Employment, 40 MW Plant (Jobs) 98 545 87Value-added, 40 MW Plant ($) 5,048,256 39,442,061 5,047,405Table 24. Operating expenditure total impacts (first year) from 20 MW and 40 MW facilities inAlachua, Duval, and Leon Counties, including output, employment, and value-added generation.ALACHUACOUNTYDUVALCOUNTYLEONCOUNTYOutput, 20 MW Plant ($) 13,336,340 13,143,123 13,067,940Employment, 20 MW Plant (Jobs) 156 150 139Value-added, 20 MW Plant ($) 7,741,232 7,547,302 7,398,046Output, 40 MW Plant ($) 25,437,424 25,937,143 24,131,245Employment, 40 MW Plant (Jobs 300 311 257Value-added, 40 MW Plant ($) 14,653,770 14,668,627 13,554,570Fuel Costs, 20 MW Plant ($) 1,906,901 1,579,580 2,289,998Fuel Costs, 40 MW Plant ($) 4,192,177 3,896,102 4,691,26871
Table 25. Capital construction output impacts for 20 MW plants, by industry.IndustryALACHUACOUNTYDUVALCOUNTYLEONCOUNTY11 Ag, Forestry, Fish & Hunting 7,033 8,918 98421 Mining 3,430 17,439 6422 <strong>Utilities</strong> 34,536 245,150 6,24023 Construction 1,124,835 3,235,462 1,009,20231-33 Manufacturing 60,606 24,930,690 27,34742 Wholesale Trade 137,526 1,798,179 100,83244-45 Retail trade 279,074 1,453,730 237,17448-49 Transportation &390,709 1,322,470 388,213Warehousing51 Information 114,364 741,263 131,04252 Finance & insurance 1,924,597 4,034,789 2,156,70253 Real estate & rental 1,222,540 2,159,424 1,204,14954 Professional- scientific &817,494 2,631,828 845,889technical services55 Management of companies 23,870 900,482 55,44056 Administrative & waste services 150,774 830,444 125,46561 Educational svcs 16,146 123,896 11,78962 Health & social services 292,957 1,523,683 224,32371 Arts- entertainment & recreation 19,420 168,729 18,16272 Accomodation & food services 142,404 792,819 121,72681 Other services 136,982 843,636 102,86992 Government & non NAICs 928,421 4,039,345 675,295Grand Total 7,827,716 51,802,373 7,442,90872
- Page 3 and 4:
ACKNOWLEDGEMENTSThe authors acknowl
- Page 5 and 6:
4.2. Scenario A: Delivered to remot
- Page 7:
Figure 22. Projected softwood and h
- Page 10 and 11:
LIST OF ACRONYMS AND ABBREVIATIONSB
- Page 12 and 13:
1. INTRODUCTION1.1. Project Backgro
- Page 14 and 15:
Task-3: Transportation. Transportat
- Page 16 and 17:
2. TASK 1: WOODSHED DELINEATION AND
- Page 18 and 19:
calculations for urban wood waste a
- Page 20 and 21:
the current pulpwood harvests are a
- Page 22 and 23:
2,0001,800Acres (thousands)1,6001,4
- Page 24 and 25: ton -1 ($17.38 green ton -1 ) for t
- Page 26 and 27: $ per million BTU, delivered$4.00$3
- Page 28 and 29: 10.65 TBtu/year required to meet de
- Page 30 and 31: haul time category in each county,
- Page 32 and 33: Figure 9. TAL Hopkins two-hour one-
- Page 34 and 35: Figure 11. GRU, JEA, and TAL woodsh
- Page 36 and 37: Dry tonsrecoverableTBtu/yearRecover
- Page 38 and 39: Dry tonsrecoverableTBtu/yearrecover
- Page 40 and 41: Table 6. Results for scenario #3,
- Page 42 and 43: Table 7. Results for scenario #4,
- Page 44 and 45: Table 9. Results for scenario #6,
- Page 46 and 47: 6.005.004.00$/MMBtu3.002.001.001: W
- Page 48 and 49: Resource/haul time categoryDry tons
- Page 50 and 51: Resource/haul time categoryDry tons
- Page 52 and 53: Table 12. Results for scenario #3,
- Page 54 and 55: Table 13. Results for scenario #4,
- Page 56 and 57: Table 15. Results for scenario #6,
- Page 58 and 59: 6.005.004.00$/MMBtu3.002.001.001: W
- Page 60 and 61: Resource/haul time categoryDry tons
- Page 62 and 63: Resource/haul time categoryDry tons
- Page 64 and 65: Table 18. Results for scenario #3,
- Page 66: Table 19. Results for scenario #4,
- Page 69 and 70: Resource/haul time categoryDry tons
- Page 71 and 72: 2.4.4. General resultsIt is difficu
- Page 73: Table 22. Yield, acreage required,
- Page 77 and 78: 3. TASK 2: SUSTAINABILITY IMPACTS F
- Page 79 and 80: under this scenario are expected to
- Page 81 and 82: acres in 1995 to 8.5 MM acres in 20
- Page 83 and 84: 3.3. RESULTS3.3.1. GRUTable 27. Res
- Page 85 and 86: 5.004.504.003.50$/MMBtu3.002.502.00
- Page 87 and 88: Table 30. Results for the conservat
- Page 89 and 90: 3.3.3. TAL Hopkins facilityTable 31
- Page 91 and 92: 5.004.504.003.50$/MMBtu3.002.502.00
- Page 93 and 94: For GRU most of these do not apply;
- Page 95 and 96: Table 33. Concentration yard costs.
- Page 97 and 98: location of the rail siding and the
- Page 99 and 100: discussed, to get an idea of the pr
- Page 101 and 102: 5. TASK 4: CO 2 EMISSIONS FROM HARV
- Page 103 and 104: in fuel chips and the carbon in fue
- Page 105 and 106: transporting coal. However, because
- Page 107 and 108: 6. COMBINED RESOURCE AVAILABILITYPa
- Page 109 and 110: Resource/haul time categoryTBtu/yea
- Page 111 and 112: Table 39. Combined resources (resou
- Page 113 and 114: Resource/haul time categoryTBtu/yea
- Page 115 and 116: Resource/haul time categoryTBtu/yea
- Page 117 and 118: Resource/haul time categoryTBtu/yea
- Page 119 and 120: OverstockedNatural Stands,0.16, 1%
- Page 121 and 122: logging residues from 90% to 60% to
- Page 123 and 124: ecommend that GRU, in coordination
- Page 125:
9. REFERENCESBlack and Veach (2004)